Queues
Overview
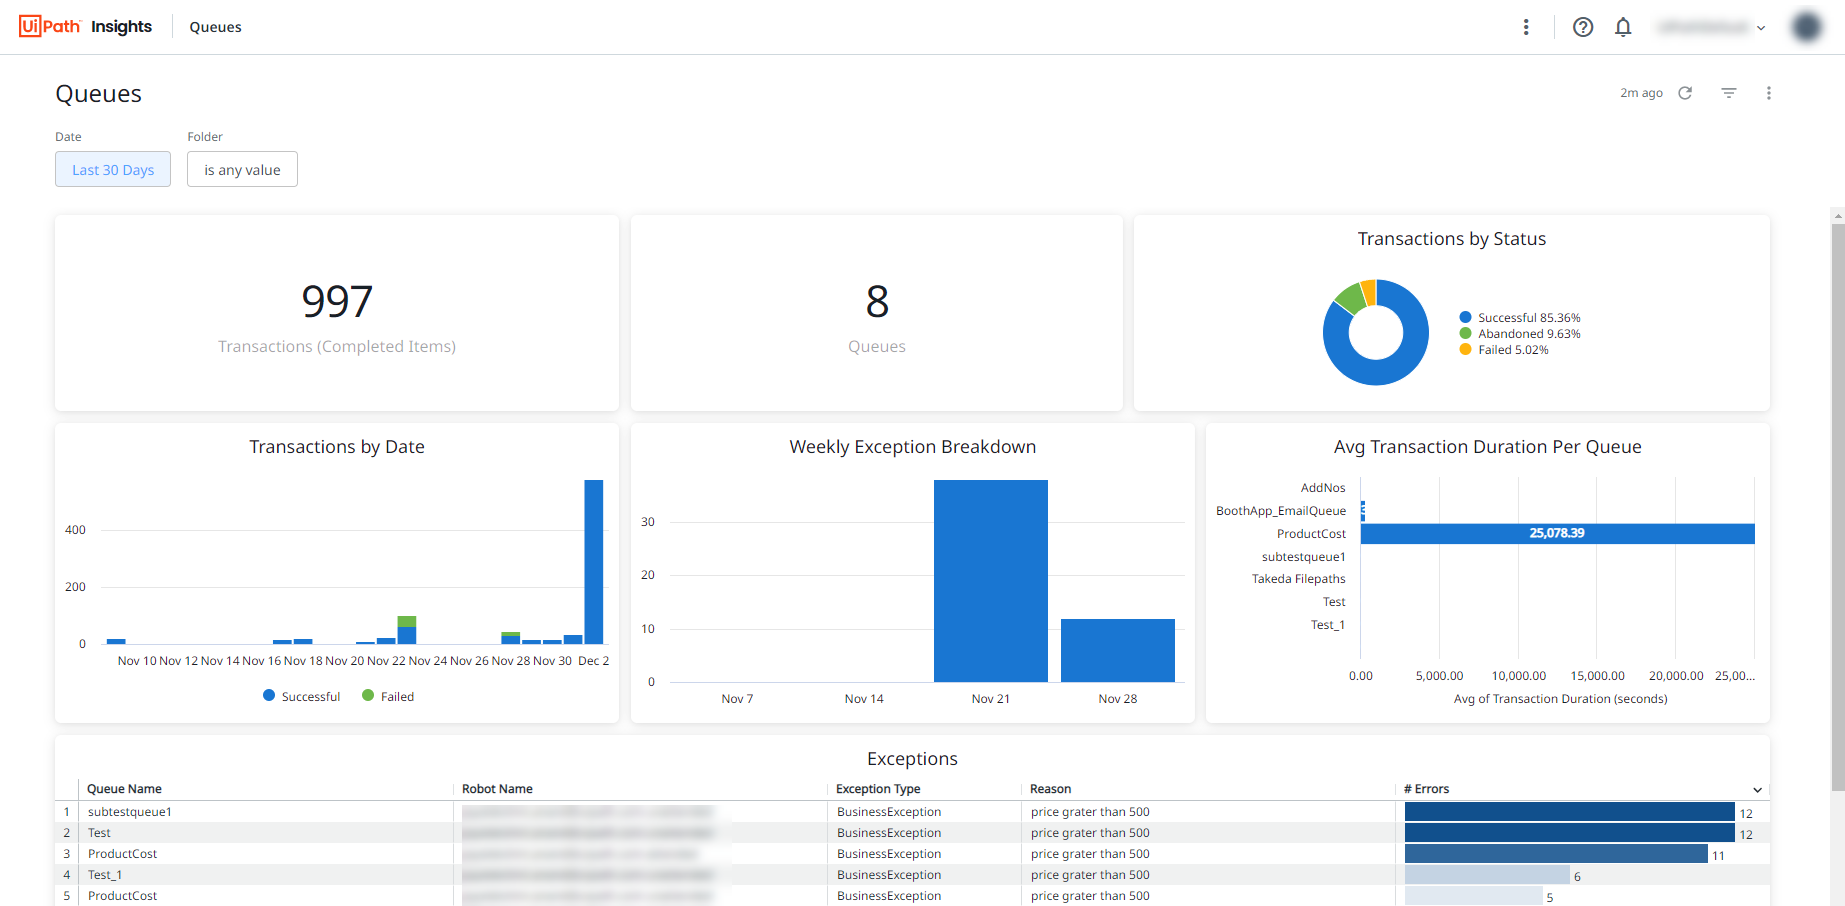
The Queues dashboard displays an overview of the number of transactions and their final states, as well as a detailed look into exceptions.
Metrics
| Tile | Metrics | Description |
|---|---|---|
| Transactions (Completed Items) | Number of completed transactions | View the number of completed transactions (queue items). |
| Queues | Number of queues | View the number of queues with data processed. |
| Transactions by Status | Number of transactions broken down by status:
|
Track the percentage of queue items in each completed status. |
| Transaction by Date | Number of transactions broken by date | Track the number of processed queues for each day. |
| Weekly Exception Breakdown | Number of exceptions per week | Track the number of exceptions regarding queue items per week. |
| Avg Transaction Duration Per Queue | Average processing time, in seconds, of queue items | Check the average time it took for queue items to be processed. |
| Exception |
|
Get a detailed look at exceptions, including the specific reason. |
Working with Queues Dashboards
To keep your automation efforts in a good condition, keep an eye on transactional processing health with the default Queues visualizations. For example, you can glance over queue items that seem to result in errors more often.