October 2025
October 29, 2025
What is new
Autopilot for Process Mining (preview)
Autopilot for Process Mining is a suite of AI-powered features designed to support the development of Process Mining apps and help business users gain faster, better insights from the data displayed on dashboards and charts.
Check out Autopilot for Process Mining for more information.
Autopilot for SQL (preview)
Autopilot for SQL is a suite of AI-powered features that assists app developers in editing and testing data transformations, reducing manual effort and ensuring the accuracy of the data used in your process app.
Watch the following YouTube video for a demo of the Autopilot for SQL in Process Mining data transformations.
Check out Autopilot for SQL for more information.
Purchase-to-Pay SAP app template
- The Purchase-to-Pay SAP app template now supports multiple processes — the purchase order item process and the accounting document process — enabling you to analyze the Purchase-to-Pay process from either perspective.
- The following process-specific dashboard is available for the Purchase-to-Pay SAP app template:
- Accounting process This dashboard provides insights into KPIs relevant to the Purchase-to-Pay process in SAP related to the accounting document process.
Check out Purchase-to-Pay SAP app template for more information.
Improvements
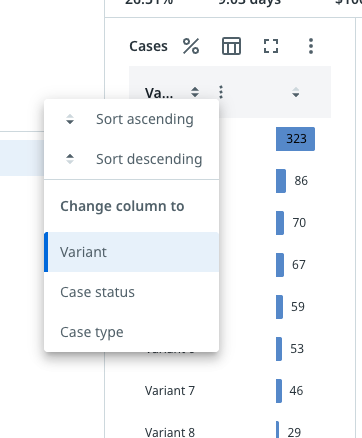
Bar charts
The new column context menu allows Business users to easily change the column settings. The following illustration shows an example.
Import BPMN process model
Import BPMN process model now supports the Inclusive choice gateway (OR).
Check out Process mining types for more information.
Editing dashboards
You can now easily copy a chart and paste it in a different location within the same dashboard or across dashboards. Copying and pasting a chart allows you to reuse your charts and make modifications without having to create entirely new charts.
Process simulation
Automation rate is now available as a node metric for the simulation process graph.
October 15, 2025
What is new
Purchase-to-Pay SAP app template
The following process-specific dashboards are available for the Purchase-to-Pay SAP app template:
- Efficiency - Order process velocity
- Efficiency - Supplier performance
- Compliance - Maverick buying
These dashboards provide insights into KPIs relevant to the Purchase-to-Pay process in SAP.
Check out Purchase-to-Pay SAP app template for more information.
Improvements
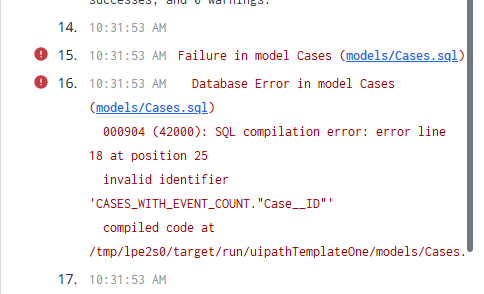
Data transformations
When a SQL compilation error occurs during data transformation, the affected file is automatically detected and linked. You can select the link to go directly to the file where you can fix the issue.
The following illustration shows an example.
Dashboard editor
Dashboards marked as hidden are now visible and accessible in Preview mode, allowing you to test and debug dashboards and charts while editing.
Input data mapping
You can now use the Search option to find a specific field in the field mapping step of the input data mapping.
Root cause analysis
Positive influencers are now indicated with a ‘+’ sign to distinguish them from negative influencers, which are marked with a ‘–’ sign.
October 7, 2025
Erratum: added October 15, 2025
This feature was not made available on the original announcement day:
Discover process model
Import BPMN process model and discover process model now support the Inclusive choice gateway (OR).
Process Simulation (General Availability)
Process simulation is now generally available.
With Process simulation you can compare the real-world behavior of your processes with the modeled version, revealing inconsistencies and opportunities for improvement. Process simulation allows you to simulate process changes using existing Process Mining data to gain insight into potential impacts on throughput times and overall performance.
Refer to Process simulation for more information.
What is new
Logic configuration editor
The GROUPED by operator for aggregate expressions, groups the field values or expression results by the values of the specified field. Each unique value (or combination of values) forms a group.
The following illustration shows an example of the GROUPED by operator:
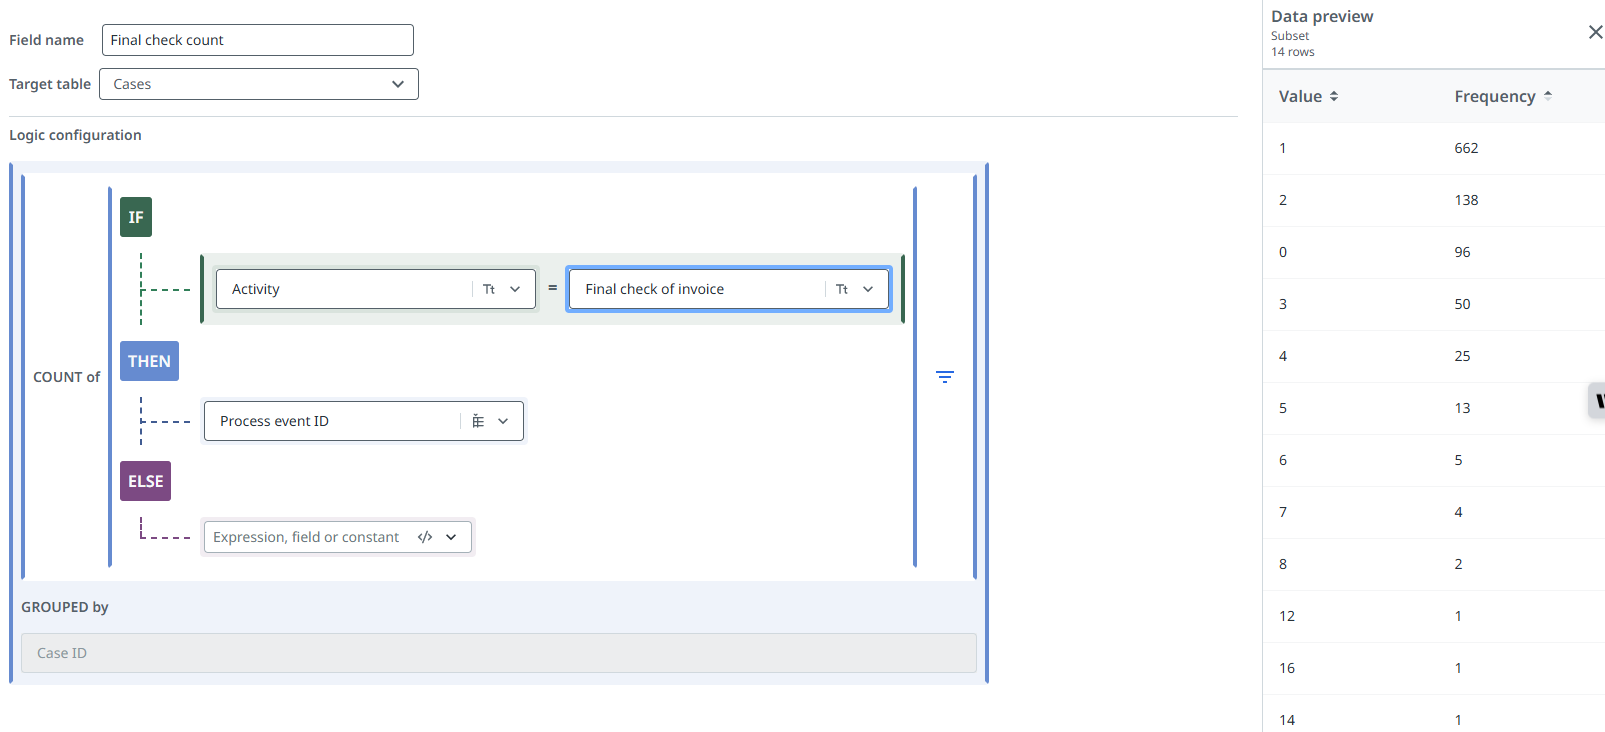
(COUNT of (IF Activity = Final check of invoice THEN Process event ID)) GROUPED by Case ID
Check out Aggregates for more information.
Improvements
Process simulation
- You can now simulate an updated automation rate using the scenario Add automation or agent.
- The Simulation dashboard now shows the Average automation rate KPI.
Loading data using CData Sync
The Loading data using CData Sync option in the wizard now provides the URI for the Blob container in the Extraction settings page. You can copy the URI and use it when setting up a destination connection in CData Sync.
Check out Create a destination connection for more information.