Action Center tasks dashboard
The Action Center tasks dashboard provides information on the tasks that work through Action Center.
KPIs
The following table describes the KPIs that are displayed on the Action Center tasks dashboard.
| KPI | Description |
|---|---|
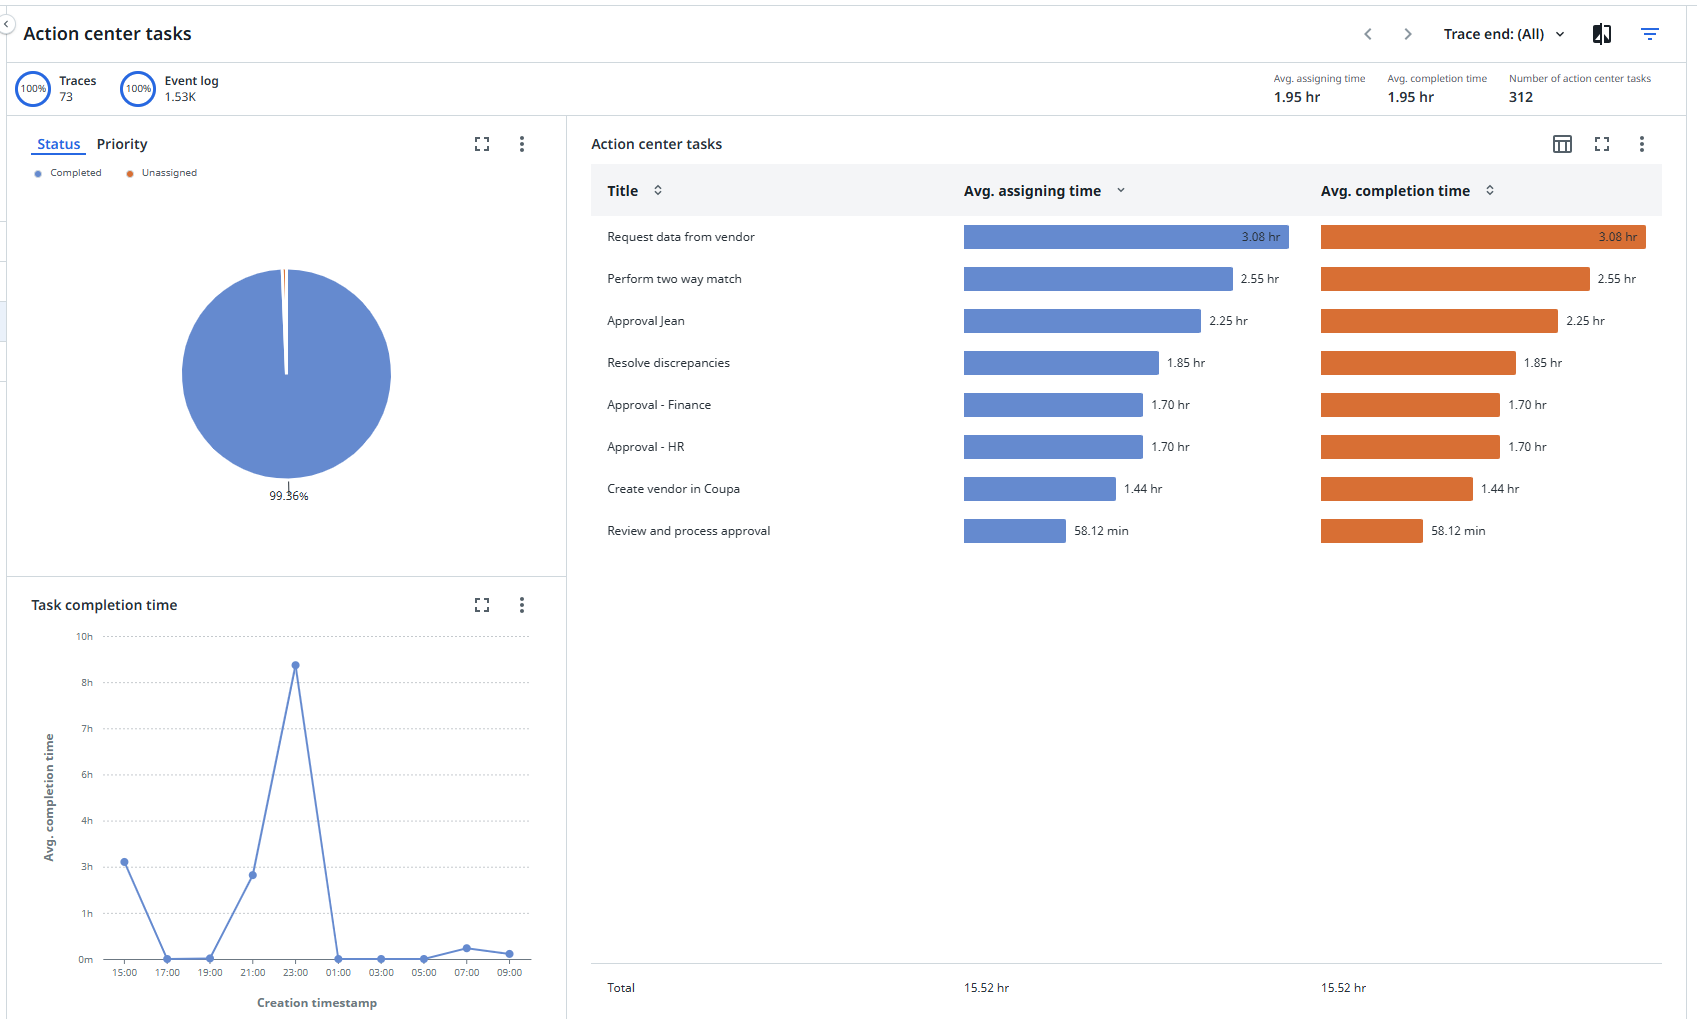
| Avg. assigning time | The mean duration between creation of a task and the most recent assignment. |
| Avg. completion time | The mean duration from task creation to task completion. |
| Number of action center tasks | The total number of pending manual Action Center tasks for the end-to-end process. |
Comparing the Average assigning time and the Average completion time can give you valuable insights into the efficiency of the process and help identify areas of process improvement and potential for automation.
A longer Average assigning time compared to Average completion time could indicate inefficiencies or bottlenecks in the task allocation. A longer completion time might suggest issues in execution or indicate complex tasks.
Status and Priority
The Status and Priority charts allow you to identify potential areas for improvement in the process. For example, by automating tasks, reallocating tasks, or allocating additional resources.
Status
The Status chart gives insights on the status of the manual tasks in the end-to-end process. It indicates the number of Completed, Pending, and Unassigned tasks of the total number of manual tasks.
Priority
The Priority chart gives insights on the priority of the manual tasks in the end-to-end process, categorized into Critical, Low, or Medium priority.
Task completion time
The Task completion time chart displays a trend in average completion time for Action Center tasks based on their specific creation timestamp. This allows you to monitor how task completion times are changing or trending over time.
For example, if completion times are consistently increasing, this might indicate bottlenecks or inefficiencies in the process. if completion times are consistently decreasing, this might indicate that process improvements or optimizations are having a positive effect.
Action center tasks
The Action center tasks chart provides insights on how many manual tasks are still outstanding at each operation in the end-to-end process.
This can help to identify bottlenecks or potential areas for improvement in the process.