Context information
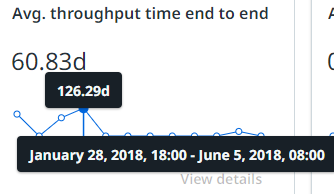
When hovering over a chart, a tooltip with context information for the chart is displayed. The following illustration shows an example of context information.
Context metrics
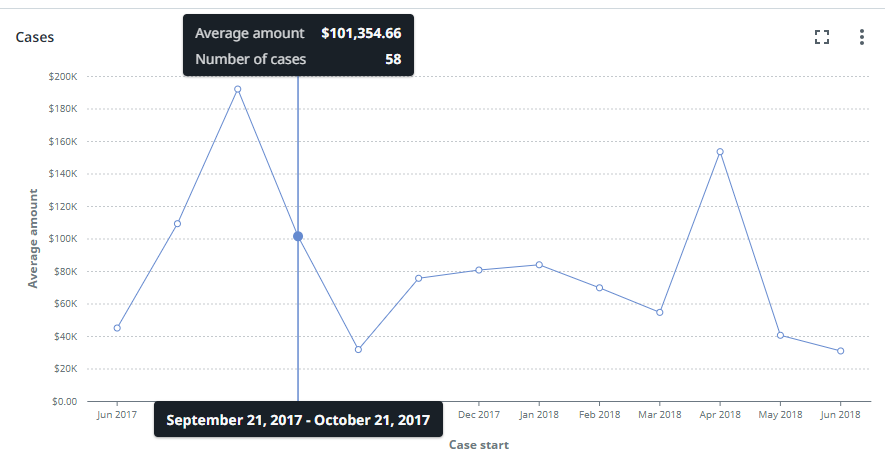
Context metrics provide a better understanding of the metric displayed on the chart. If a context metric is available for the main metric, the context metric is also displayed in the tooltip.
The following illustration shows a chart with the main metric Average amount and Number of cases as a context metric.