Context metrics
You can add context metrics to provide a better understanding of the main metric displayed on the chart. Context metrics are displayed as tooltips on charts.
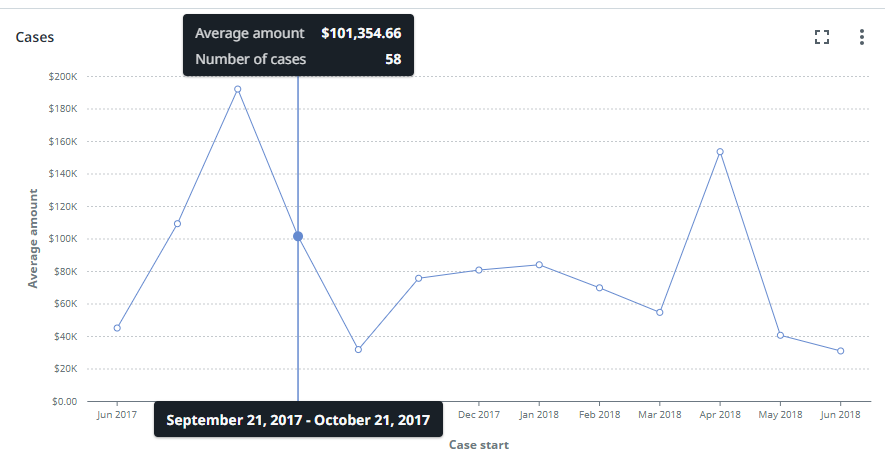
The following illustration shows a chart with the main metric Average amount and Number of cases as a context metric.
Depending on the calculation of the main metric, different contexts may be useful to explain the main metric. For example, if the main metric is defined as Average amount, useful context is Number of objects for which the average amount is calculated. This also applies when you main metric is defined as Total amount. In this case, also Number of objects for which the sum is calculated is a useful context.
When your main metric is defined as a percentage, for example Cases with tag (%), useful contexts can be Number of objects with tag and Total number of objects.
The following table shows some examples of main metrics with relevant context metrics.
| Main metric | Context metric 1 | Context metric 2 | |
|---|---|---|---|
| Count | Number of objects 112 | - | - |
| Average | Average amount € 61,43 | Objects 112 | - |
| Sum | Total amount € 123.555,00 | Objects 112 | - |
| Percentage | Objects with tag % 60% | Objects with tag 600 | Total objects 1000 |