Summary dashboard
The Summary dashboard provides high-level trace information. You can use this information to get a global overview of the data.
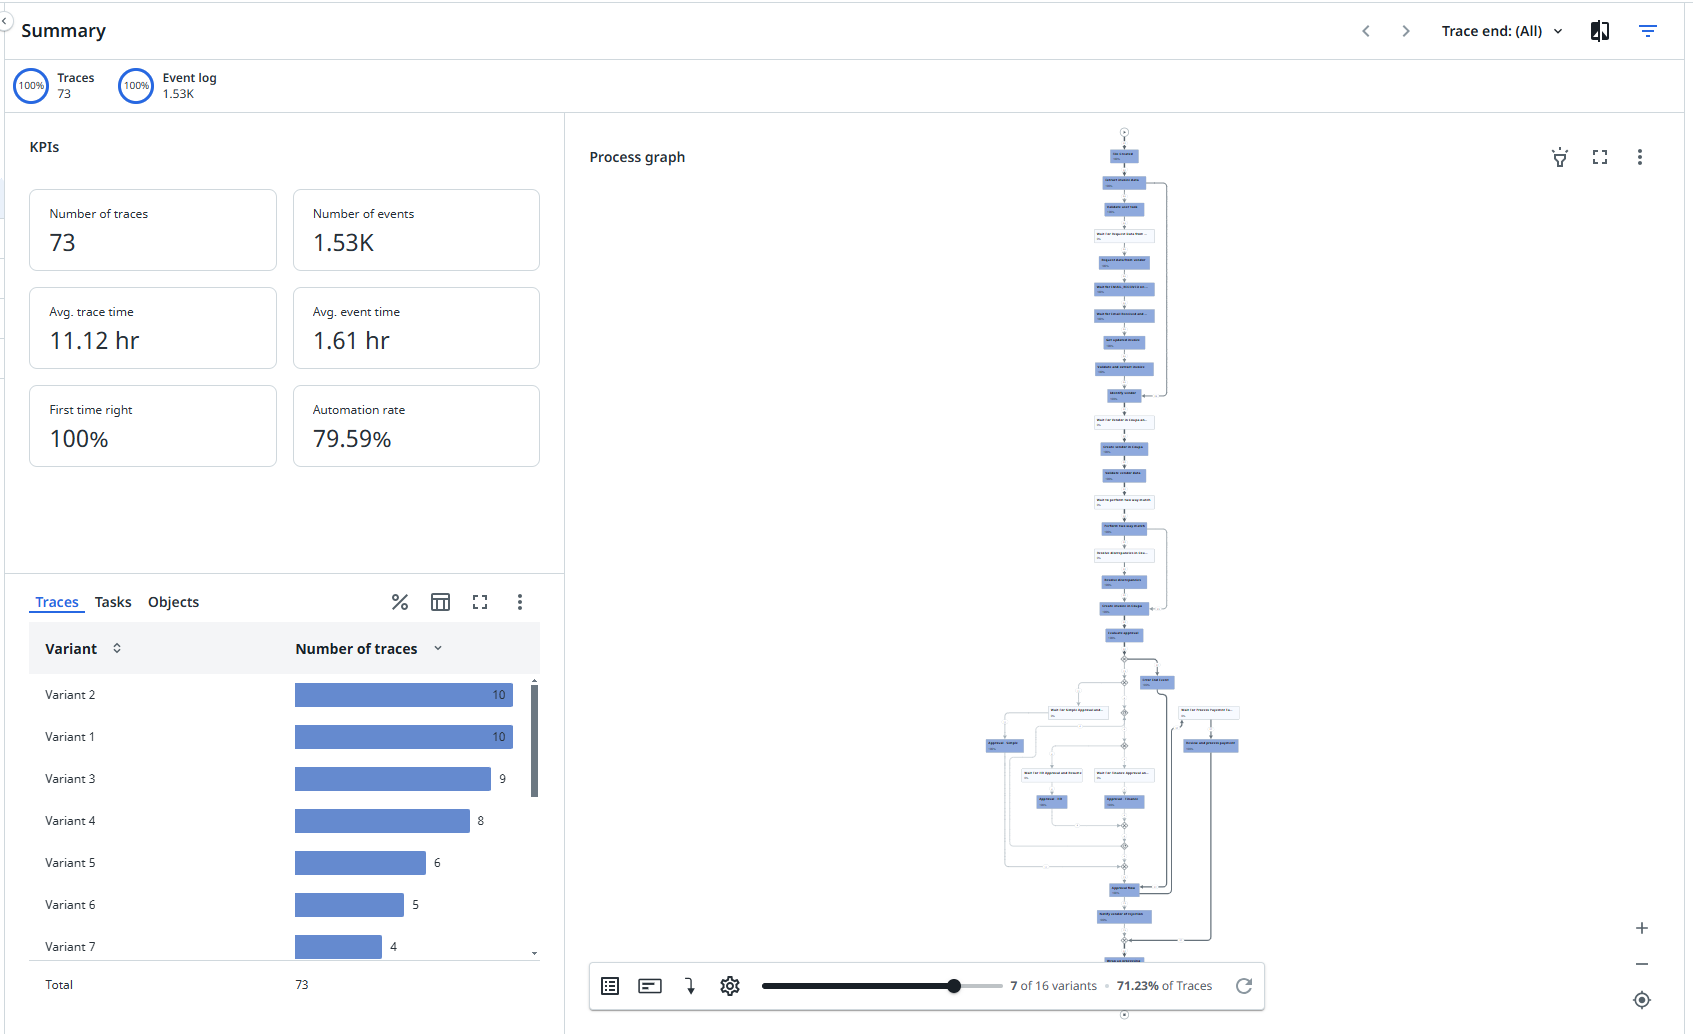
KPIs
The following table describes the KPIs that are displayed on the Summary dashboard.
| KPI | Description |
|---|---|
| Number of traces | The number of traces. |
| Avg. trace time | The average trace throughput time for the end-to-end process. |
| First time right | The percentage of traces that have been processed without revisions. |
| Number of events | The number of events. |
| Avg. event time | The average event cycle time for the end-to-end process. |
| Automation rate | The percentage of automated events in the end-to-end process. |
Process graph
The process graph displays the end-to-end process for the trace.
You can use the Variants slider to see the happy path and zoom in to see the variants. The happy path is changing when additional logic is added in the process.
You can select a different metric from the node and edge metrics selector to display the process graph based on different metrics. The following tables describes the available metrics.
Node metrics
| Metric | Description | Base |
|---|---|---|
| Number of traces | The number of traces. | Traces |
| Automation rate | The percentage of automated events in the end-to-end process. | Event log |
| Number of events | The total number of events in the end-to-end process. | Event log |
| Avg. event time | The average event throughput time for the end-to-end process. | Event log |
| Total event time | The total event throughput time for the end-to-end process. | Event log |
Edge metrics
| Metric | Description | Base |
|---|---|---|
| Number of transitions | The total number of transitions inf the process. | Process |
| Average throughput time | The average throughput time between the tasks. | Process |
| Traces | The number of traces. | Traces |
Check out Working with process graphs and Working with Discover process models and Import BPMN models.
Traces, Tasks, and Objects
Traces
The Traces tab of the bar chart displays the number of traces for each variant of the end-to-end process.
Tasks
The Tasks tab of the bar chart displays the automation rate for each task of the process.
Objects
The Objects tab displays the number of objects for each object type defined for the process.