Process graphs
Introduction
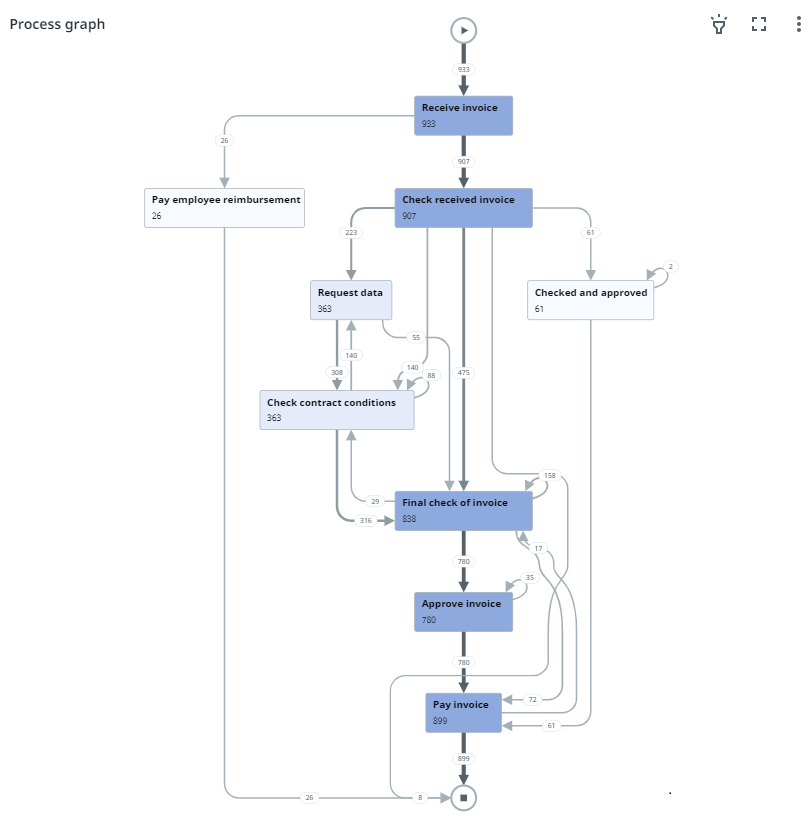
A process graph is a visual representation of the order in which events took place based on the data. The graph consists of the activities of your workflow, so-called nodes, and edges which represent the transitions in between the activities. A process graph gives insight into how the steps of a process relate to each other and shows all possible paths that cases take through the process. The following illustration shows an example of a process graph.
Editing a process graph
Follow these steps to edit a process graph.
| Step | Action |
|---|---|
| 1 | In the dashboard editor go to the dashboard for which you want to edit a process graph. |
| 2 | Select the process graph you want to edit to select it. |
The properties panel opens at the right, displaying the editable process graph properties.
Switching values
To enable end-users to switch between different values in the process graph, you can select different metrics that will be added to the metric selector.
Properties
You can edit the properties of a process graph in the Edit process graph panel.
The following table describes the properties of the Process graph.
| Element |
Description |
|---|---|
| Title |
Text box that enables you to edit the title of the process graph. |
| Tooltip |
Text box that enables you add a text that will be displayed as tooltip when the user hovers the mouse over the process graph title in the published process app. |
| Process |
List box that enables you to select the process to be displayed in the process graph. Note: The Process field is only available if multiple processes are defined for the process app. Check out Adding and editing processes for more information. |
| Node metric |
List of metrics selected to be displayed for the activities.
Note: You must at least select one metric. If you select multiple metrics, the first metric will be displayed by default. |
| Edge metric |
List of metrics selected to be displayed for the edges.
Note: You must at least select one metric. If you select multiple metrics, the first metric will be displayed by default. |