Analysis - End to end
Introduction
End to end is the dashboard where you can analyze the complete process regarding cases using various fields and metrics.
Context information
The context bar at the top of the End to end dashboard displays context information and KPI's.
The following table describes the elements of the context bar.
| KPI | Description |
|---|---|
| Automation rate | The percentage of automated events in the end-to-end process. |
| Avg. throughput time | The average throughput time for the end-to-end process. |
| Total case value | The total value of cases created during the selected period. |
| Number of cases | The number of unique cases created during the selected period. |
Metrics
The End to end dashboard enables you to select various fields and metrics to analyze cases.
The following table describes the metrics that can be selected in the End to end dashboard.
| Metric | Description | Base |
|---|---|---|
| Number of cases | The number of unique cases. | Cases |
| Avg. case value | The average case value of cases created during the selected period. | Cases |
| Total case value | The sum of the values of the cases created during the selected period. | Cases |
| Avg. throughput time | The average throughput time for the end-to-end process. | Cases |
| Total throughput time | The total throughput time for the end-to-end process. | Cases |
Distribution
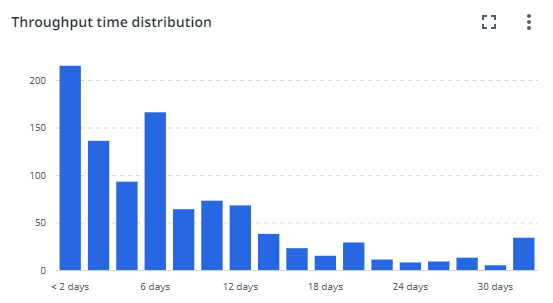
The Distribution chart enables you to analyze the frequency of cases based on Throughput time.
Process graph
The process graph displays the end-to-end process based on the number of cases.
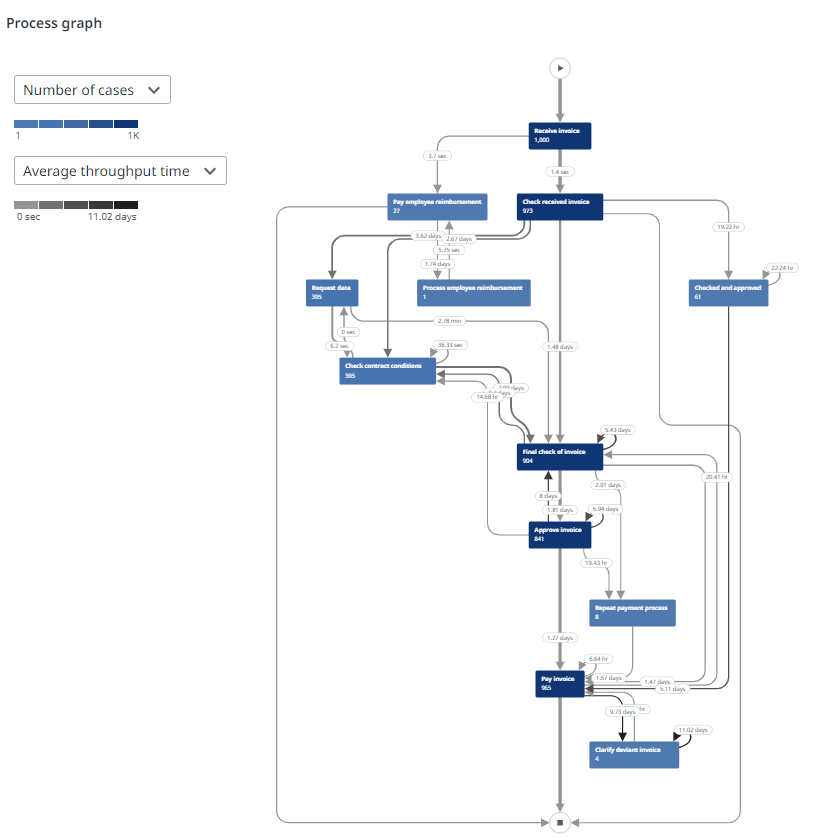
You can use the Detail slider to change the number of activities and/or edges shown. Check out Working with process graphs.
You can select a different metric from the activity and edge metrics selector to display the process graph based on different metrics. The following tables describe the available metrics.
Activity metrics
| Metric | Description | Base |
|---|---|---|
| Number of cases | The number of unique cases. | Cases |
| Avg. case value | The average case value of cases created during the selected period. | Cases |
| Total case value | The sum of the values of the cases created during the selected period. | Cases |
| Number of events | The total number of events. | Event log |
| Avg. number of events | The average number of events. | Event log |
| Avg. event throughput time | The average throughput time for the end-to-end process. | Event log |
| Total event throughput time | The total throughput time for the end-to-end process. | Event log |
Edge metrics
| Metric | Description | Base |
|---|---|---|
| Number of cases | The number of unique cases. | Cases |
| Average throughput time | The average throughput time between the activities. | Process |
| Number of transitions | The number of transitions between the activities. | Process |