Analysis - End to end process
Introduction
Analysis - End to end process is the main dashboard where you can analyze the complete Order-to-Cash process regarding sales order items.
KPIs
The following table describes the KPIs that are displayed at the top of the Analysis - End to end process dashboard.
| KPI | Description |
|---|---|
| Automation rate | The percentage of automated events in the Order-to-Cash process from end-to-end. |
| Variants | The number of various process paths different sales order items have taken from end-to-end. A variant is a specific path through the process, a set of activities that was taken in a specific order. Usually, several sales order items have followed the same variant. |
| Avg. throughput time end to end | The average throughput time for the end-to-end process, from creating a sales order to the actual payment for the related invoice. |
| Total item value | Total value of the sales order items. |
| Number of items | Total number of sales order items. |
| Sales orders | The total number of sales orders created. |
End to end process
With the End to end process dashboard item, you can analyze the sales order items and throughput times in more detail. You can create various contexts by selecting different fields and metrics.
The following table describes the metrics.
| Metric |
Description |
Base |
|---|---|---|
| Number of items |
The number of unique sales order items created within the selected period. |
Sales order items |
| Avg. item value |
The average value of sales orders created within the selected period. |
Sales order items |
| Total item value |
The total value of sales orders created within the selected period. |
Sales order items |
| Avg. throughput time end-to-end |
The average throughput time between the first and the last event for sales order items created within the selected period. Note: The throughput time is calculated only if both dates are available and occurred in the right order. |
Sales order items |
| Avg. throughput time sales order item creation to create accounting document |
The average throughput time from creating the sales order item to the actual creation of the accounting document for sales orders created within the selected period. Note: The throughput time is calculated only if both dates are available and occurred in the right order. |
Sales order items |
| Avg. throughput time SO item creation to post goods issue |
The average throughput time from creating the sales order item to the actual post of the goods for sales orders created within the selected period. Note: The throughput time is calculated only if both dates are available and occurred in the right order. |
Sales order items |
| Avg. throughput time SO item creation to receive proof of delivery |
The average throughput time from creating the sales order item to the actual delivery of the goods for sales orders created within the selected period. Note: The throughput time is calculated only if both dates are available and occurred in the right order. |
Sales order items |
Metrics in the Order-to-Cash Discovery Accelerator never take Sales order items with missing data into account when the metric is calculated. For example, if a Sales order item does not have a value for the selected category and the metric calculates the average over this category, the Sales order item is not taken into account.
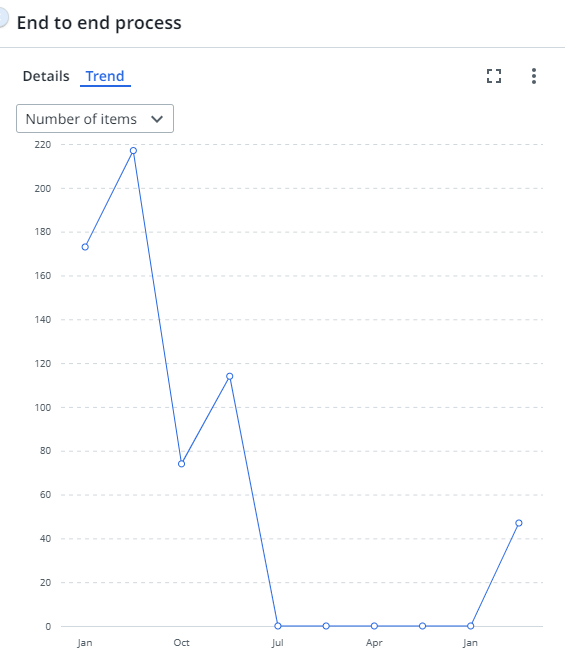
Trend
The graph on the Trend tab shows the metric values for the selected category over time. The following illustration shows an example trend line.
Process graph
The process graph displays the end-to-end process based on the number of sales order items.
You can use the Detail slider to change the number of activities and/or edges shown. Check out Working with process graphs.
You can select a different metric from the activity and edge metrics selector to display the process graph based on different metrics. The following table describes the available metrics.
Activity metrics
| Metric | Description | Base |
|---|---|---|
| Number of items | The number of unique sales order items created within the selected period. | Sales order items |
| Avg. item value | The average value of sales order items created during the selected period. | Sales order items |
| Total item value | The sum of the values of the sales order items created during the selected period. | Sales order items |
| Avg. event throughput time | The average throughput time for the end-to-end process. | Sales order item end to end events |
Edge metrics
The following table describes the edge metrics.
| Metric | Description | Base |
|---|---|---|
| Number of items | The number of unique sales order items. | Sales order items |
| Average throughput time | The average throughput time between the activities. | Process |
| Number of transitions | The number of transitions between the activities. | Process |