Analysis - Event analysis
Introduction
Analysis - Event analysis is the main dashboard where you can analyze the events that occur in the Purchase-to-Pay process.
The information displayed in the dashboard is based on the creation date of the purchase order items. The Period filter in the Filter panel enables you to select a period to display the purchase order items that were created in the selected period.
Since the process graph displays all purchase order items which are created within the selected time period, the graph can also contain changes to these purchase order items that might be outside of the selected period.
KPIs
The following table describes the KPIs that are displayed at the top Analysis - Event analysis dashboard.
| KPI | Description |
|---|---|
| Avg. event throughput time | The average event throughput time for purchase order item events. |
| Total item value | The total value of the purchase order items. |
| Number of items | The total number of unique purchase order items. |
Timestamps
Throughput time is the duration between the event end timestamps of two events that follow each other. In this case, waiting time and idle time are also calculated. Processing time is the time actually spent on the event. In this case, waiting time and idle time are not taken into account.
Details
With the Details dashboard item, you can analyze the purchase order item events in more detail.
You can create various different contexts by selecting different fields from the drop-down list. For example, when you select the Activity trigger you can analyze the reason that triggered the purchase order item event.
The metric selector enables you to select different metrics. The following table describes the metrics that can be used to analyze the purchase order item events regarding the selected field.
| Metric | Description | Base |
|---|---|---|
| Number of items | The number of unique purchase order items, created within the selected period. | Purchase order items |
| Number of events | The number of unique purchase order item events, within the selected period. | Purchase order item end to end events |
| Avg. number of events | The average number of events that were performed on purchase order items, within the selected period. | Purchase order item end to end events |
| Avg. event throughput time | The average throughput time of all purchase order items events, within the selected period. | Purchase order item end to end events |
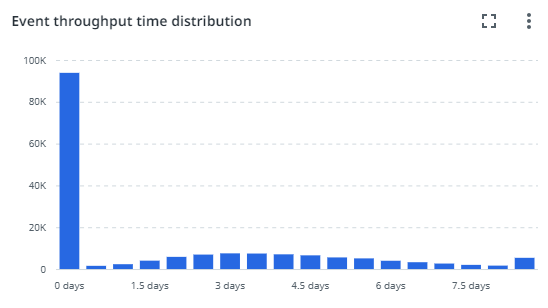
Distribution
The Distribution chart enables you to analyze the frequency of events based on the Event throughput time.
Process graph
The process graph displays the Purchase-to-Pay process based on the number of events.
You can select a different metric from the activity and edge metrics selector to display the process graph based on different metrics. The following table describes the available metrics.
You can use the Details slider to change the number of activities and/or edges shown. Check out Working with process graphs.
Activity metrics
| Metric | Description | Base |
|---|---|---|
| Number of items | The number of unique purchase order items, created within the selected period. | Purchase order items |
| Number of events | The number of unique purchase order item events, within the selected period. | Purchase order item end to end events |
| Avg. number of events | The average number of events that were performed on purchase order items, within the selected period. | Purchase order item end to end events |
| Avg. event throughput time | The average throughput time of all purchase order items events, within the selected period. | Purchase order item end to end events |
Edge metrics
| Metric | Description | Base |
|---|---|---|
| Number of items | The number of unique purchase order items. | Purchase order items |
| Average throughput time | The average throughput time between the activities. | Process |
| Number of transitions | The number of transitions between the activities. | Process |