Pie charts
Introduction
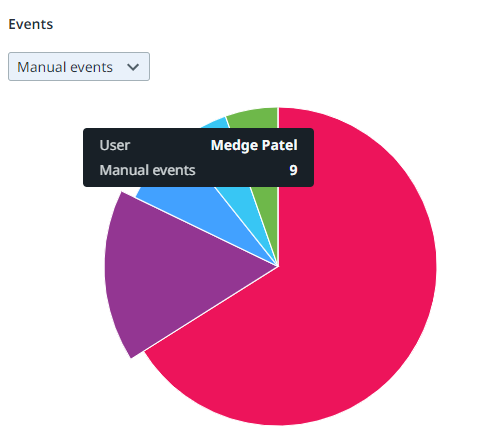
Pie charts can be used to compare the relative proportions of a certain metric within a category. The data in a pie chart is displayed in slices that form a circular graph. Each slice of the pie is relative to the size of the category used for the chart. The entire chart represents the total (number or 100%) of the category, while each slice represents a part of the total. See the illustration below for an example.
Properties
You can edit the properties of a pie chart in the Edit pie chart panel.
Below is a description of the properties of the Pie chart.
| Element | Description |
|---|---|
| Title | Text box that enables you to edit the title of the pie chart. |
| Tooltip | Text box that enables you add a text that will be displayed as tooltip when the user hovers the mouse over the chart title in the published process app. |
| Fields | List box that enables you to select the category used for the slices on the pie chart. |
| Metrics | List box that enables you to select the metric that defines the values displayed on the slices. You can select multiple metrics to add them to a metric selector. See the illustration below for an example. |
| Remove chart | Button that enables you to remove the chart. See Dashboards. |

Maximum number of slices
A pie chart displays up to six slices. If the data consists of more slices for the selected category, a sixth slice is displayed for the remaining values. See the illustration below for an example.
