Menu Efficiency
The dashboards of the Efficiency menu display a graphical representation of the process and give insight into the process flow and performance.
The Efficiency menu has the following dashboards:
Efficiency - Customers: the dashboard where you can monitor and analyze customer-related data.
Efficiency - Customers
Introduction
Efficiency - Customers is the dashboard where you can analyze the customers involved in the Order-to-Cash process. It displays detailed information on the late delivery rates, the sales order items, and the number of unique customers per category.
KPIs
The following table describes the KPIs that are displayed at the top of the Efficiency - Customers dashboard.
| KPI | Description |
|---|---|
| Late delivery rate | The percentage of sales order items of which at least a part was expected to be delivered after the requested delivery date within the selected period. |
| Number of customers | The number of customers that were involved in sales order items within the selected period. |
| Total item value | Total value of the sales order items. |
| Number of items | The total number of sales order items. |
| Sales orders | The total number of sales orders. |
Dashboard charts
The following table describes the dashboard charts of the Efficiency - Customers dashboard.
| Chart | A bar charts that displays... |
|---|---|
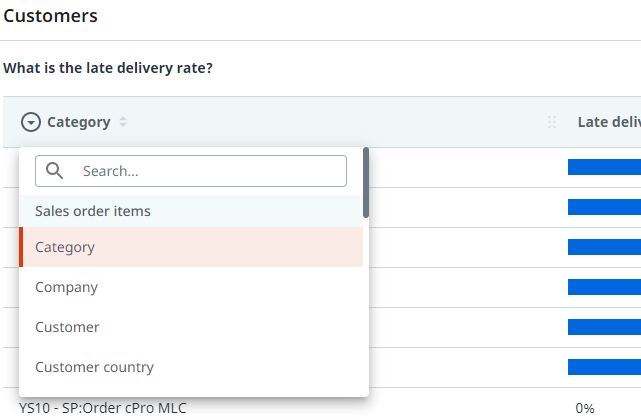
| What is the late delivery rate? | the percentage of sales order items that were delivered after the expected delivery date within the selected period. Note that when hovering over the bar the Late delivery rate percentage and the number of Delivered SO items are displayed for the selected category. |
| Sales order items | detailed information on sales order items related to the selected category. You can select different metrics and categories to change the context. |
| How many unique customers per category? | detailed information on the number of customers for the selected category. |
Fields
You can create various different contexts based on sales order items by selecting a different category from the drop-down list.
Metrics
You can select a different metric from the metric selector to analyze various aspects regarding sales order items.
The followinbg table describes the metrics that can be used to analyze the sales order items regarding the selected category.
| Metric | Description | Base |
|---|---|---|
| Number of items | The number of unique sales order items created within the selected period. | Sales order items |
| Avg. item value | The average value of sales orders created within the selected period. | Sales order items |
| Total item value | The total value of sales orders created within the selected period. | Sales order items |