Viewing the data run logs
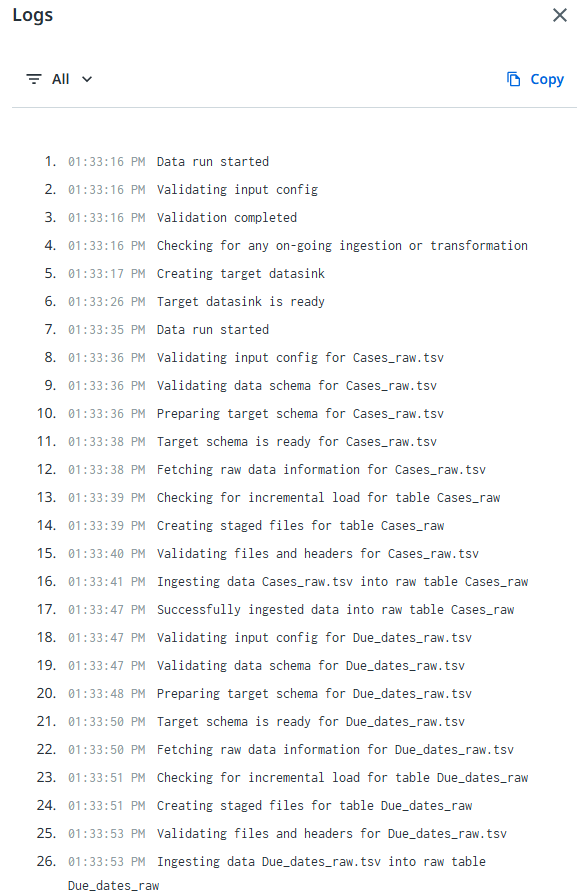
The Logs panel shows what happens in the background. The Logs panel is refreshed automatically every couple of seconds. The following illustration shows an example.
Displaying the Logs panel
Select the View logs button in the header bar of the Data transformations window to display the Logs panel.
The View logs button is a toggle button. When the Logs panel is visible, select the View logs button to hide the Logs panel.
Log levels
The log contains different log levels to indicate the severity of the message:
| Log level | Description | Data run status |
|---|---|---|
| Information | An Information message contains helpful information on the progress of the datarun. | Success |
| Warning | A Warning refers to a potential problem in your data that might affect what will be displayed on a chart in the published process app. It is advised to resolve any warnings to prevent any potential future problems. | Success |
| Error | An Error refers to a mistake in your data that prevents the process app from loading the data or running the transformations. You must resolve all errors to enable a successful data run. | Failed |
Filtering logs
By default, Errors, Warnings, and Information messages are displayed when you open the Log. You can use the Filter menu to change the log level. The following illustration shows an example.

Saving the log file
You can select the ![]() icon to copy the contents of the log file and paste in, for example, a Notepad file that you can save on your computer. This enables you to view the messages when working on solving the issues causing errors or warnings.
icon to copy the contents of the log file and paste in, for example, a Notepad file that you can save on your computer. This enables you to view the messages when working on solving the issues causing errors or warnings.
This also enables you to share the contents of the log file, for example if you need support.