Adding custom metrics to the process graph
Introduction
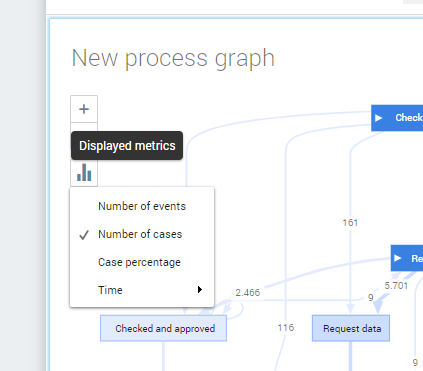
If you create a process graph the default metric that is used to display the process is the Number of cases. See illustration below.
Changing the default metric for the process graph
Follow these steps to change the default labels used in the process graph.
| Step | Action |
|---|---|
| 1 | Click on the Process graph and go to the Process Graph tab. |
| 2 | Click on ADVANCED... in the General panel. |
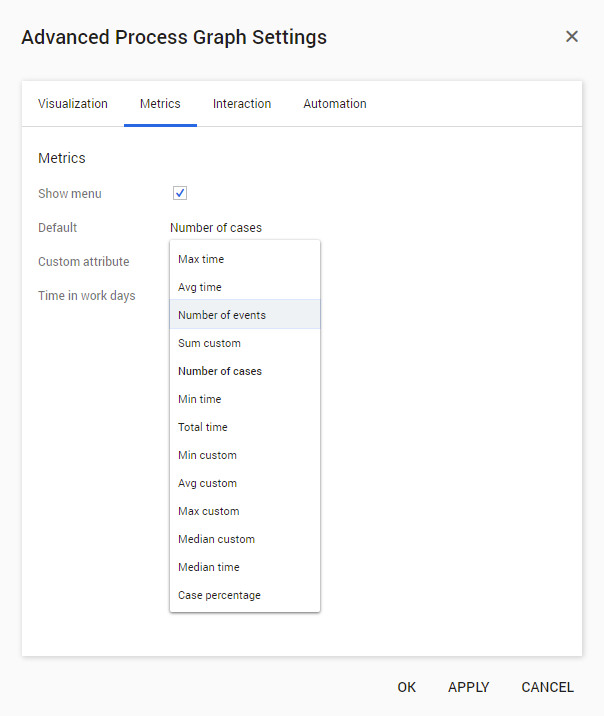
| 3 | Go to the Metrics tab. |
| 4 | Click on Number of cases in the Default field. |
| 5 | Select the metric you want to use for the process graph from the drop-down list, and click on OK. See the illustration below. |
Adding an attribute
You can also define an additional attribute that can be used to display the process graph. The attribute is added to the displayed metrics menu in the process graph
Follow these steps to change the default labels used in the process graph.
| Step | Action |
|---|---|
| 1 | Click on the process graph and go to the Process Graph tab. |
| 2 | Click on ADVANCED... in the General panel. |
| 3 | Go to the Metrics tab. |
| 4 | Click on none next to the Custom attribute field. |
| 5 | Select the attribute you want to add to the menu and click on OK. See the animation below. |