Chart positioning
Introduction
When multiple dashboard items are added, the position of each dashboard item determines the overall layout of the dashboard. The grid layout determines the position of an item on the dashboard. See illustration below.
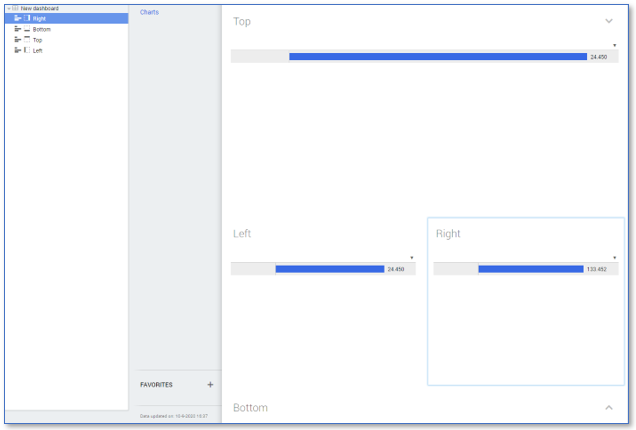
The default position for the first chart on a dashboard is Center. When you create a second chart the Position of the new chart is automatically set to Bottom.
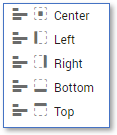
The positioning of dashboard items is indicated by an icon to the left of their name.
See the illustration below.
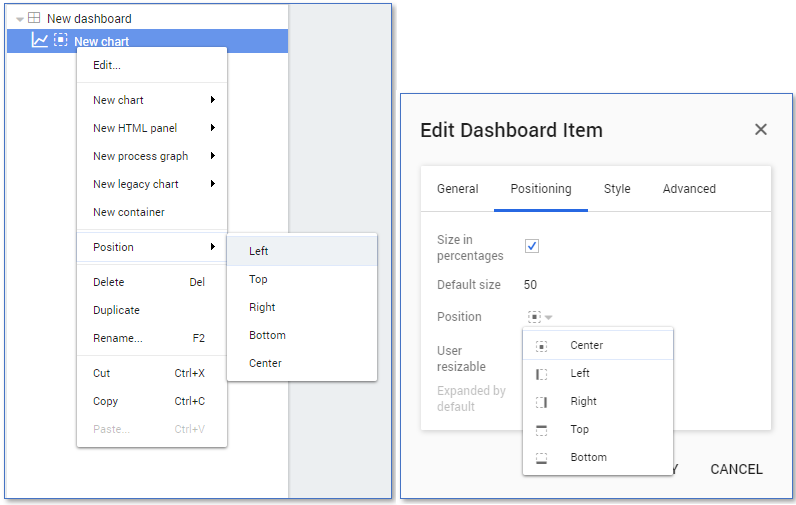
There are two ways to change the position of a chart.
- From the context menu.
- From the Edit Dashboard item dialog.
Follow these steps to change the position of a chart from the context menu.
| Step | Action |
|---|---|
| 1 | Open the app or discovery accelerator in your development environment and go to the Dashboards tab. |
| 2 | In the dashboard item list, right-click on the chart for which you want to change the position. |
| 3 | Select Position from the context menu and then the desired position for the chart. |
Follow these steps to change the position from the Edit Dashboard item dialog.
| Step | Action |
|---|---|
| 1 | In the dashboard item list, double-click on the chart for which you want to change the position. |
| 2 | Go to the Positioning tab in the Edit Dashboard item dialog. |
| 3 | Select the desired position from the Position drop-down list. |
There can be only one dashboard item with the Center position.
Dashboard item size
You can create dashboards with items of different sizes. The Positioning tab of the Edit Dashboard item dialog displays the current position settings of the selected dashboard item. The Default size field displays the current size of the selected dashboard item.
Below is a description of the elements of the elements of the Positioning tab.
| Element | Enables you to... |
|---|---|
| Size in percentages | specify the size in percentages instead of in pixels. |
| Default size | change the size of the selected dashboard item. |
| Position | change the position of the selected dashboard item. |
| User resizable | give the end user the option the manually change the size of the dashboard item. |
The size of a dashboard item with Center position is dependent on the available space. For example, if the left chart in the demo has a default size of 20%, the center chart automatically uses the remaining 80% of the space.
Containers and tab containers
Containers can be used to group dashboard items together. Using a container gives much more flexibility in designing dashboards. Containers can be positioned in the same way as dashboard items. The items in a container can be positioned relative to that container.
When containers are used to position other dashboard items, the header of the container can be disabled.
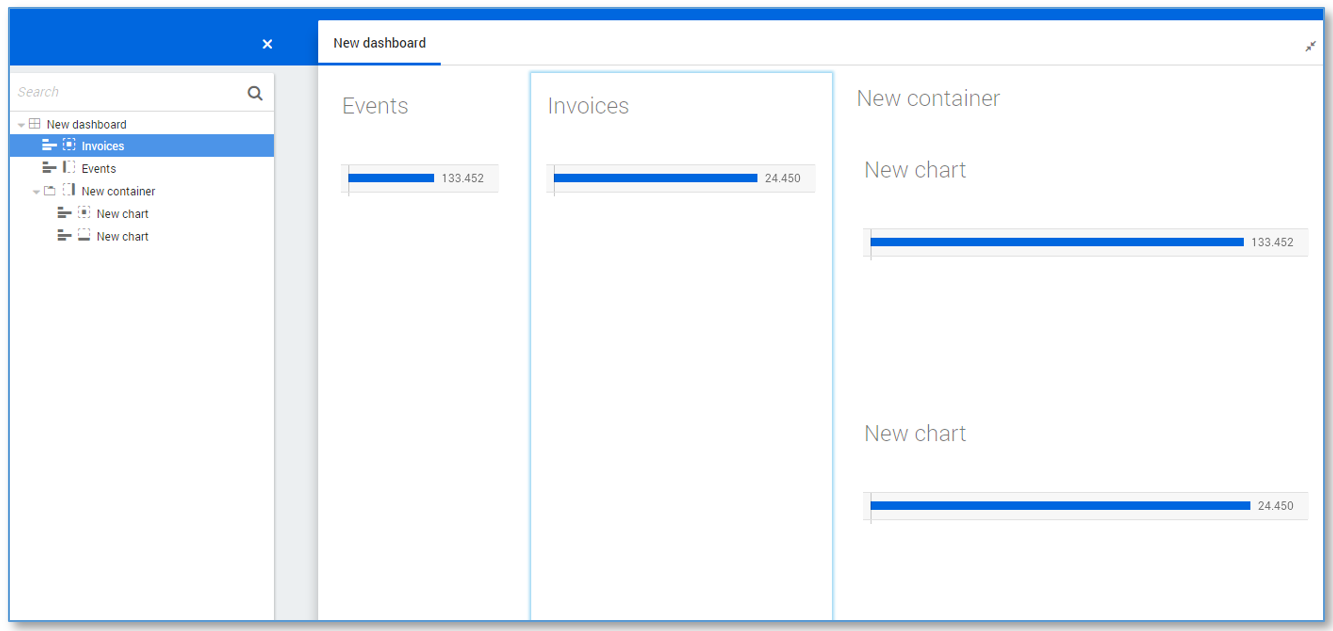
Follow these steps to create a container.
| Step | Action |
|---|---|
| 1 | Go to a dashboard with multiple charts. |
| 2 | Right-click in the dashboard item list and select New container. |
| 3 | Drag and drop the two charts into New container. |
| 4 | Change the position of the container as desired. |
See illustration below for an example.
Using a tab container, end users can switch between different tabs that each contains a container with dashboard items.
Follow these steps create a tab container.
| Step | Action |
|---|---|
| 1 | Right-click on a container in the dashboard item list and select Edit.... |
| 2 | Select the Tab container check box and click on OK. |
The dashboard items in the container are now visible as different tabs. This can be used to reduce the total number of actual dashboards.