Example analysis
Introduction
Below is an illustration of the results of a profiling run.

In this example, it is detected that the loading of Dashboard A is relatively slow.
Drilldown on dashboard
As a developer, you can choose what should be investigated. However, most likely you will choose to investigate the slowest dashboard. In this case, we drilldown on Dashboard A. See illustration below.
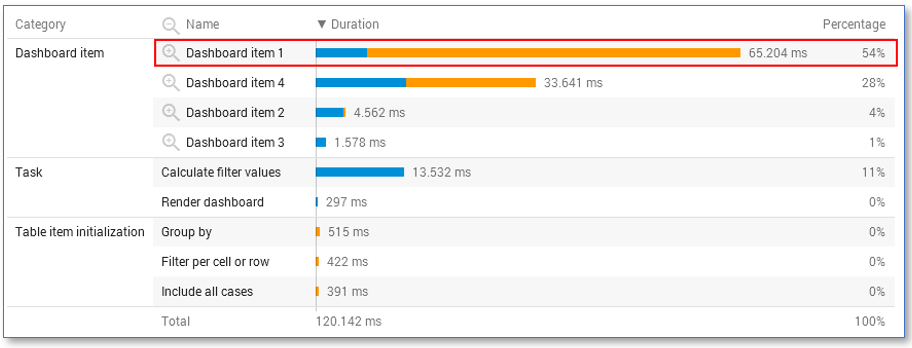
It is detected that the loading of Dashboard item 1 takes a lot of time.
Drilldown on dashboard Item
On dashboard item level, it is also the best to drilldown to the dashboard item that takes the most time. In this case, we drilldown further on Dashboard item 1. See illustration below.
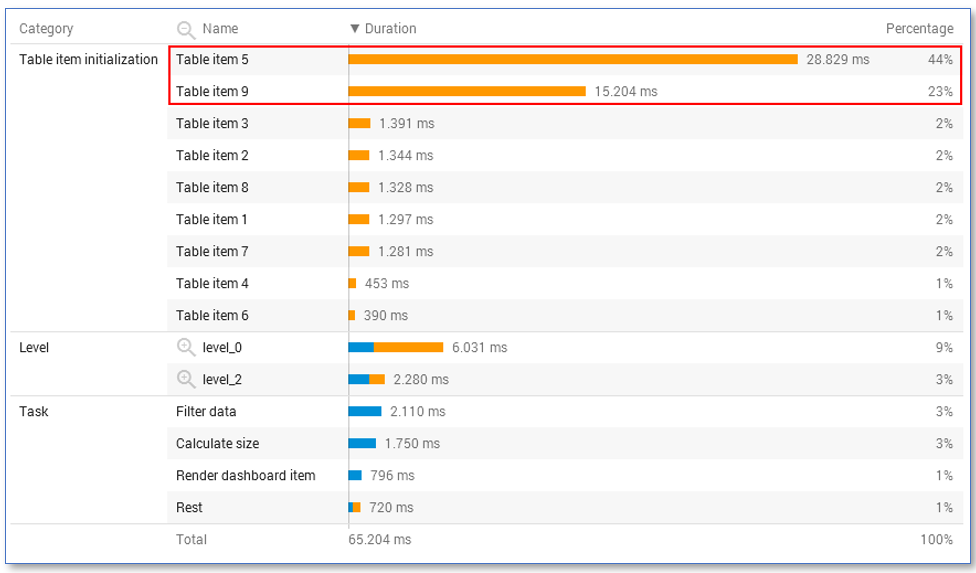
It works out that Table item 5 and Table item 9 are taking most of the time. You can now go to the application in your developer environment and investigate whether these expressions are still needed and whether the expressions can be redesigned to do the same but on a faster way.