Maps
Introduction
A map attribute maps the values of another attribute to new values. It can be used to group values together. Also, maps can be used to give values to a specific color.
Creating a map
Follow these steps to create a map.
| Step | Action |
|---|---|
| 1 | Go to Data tab in your app development environment. |
| 2 | In the table list, click on the table in which you want to create an expression. The table items are displayed in the table item list. |
| 3 | Right click on the data source attribute for which you want to create a map and select New map…. The Edit Map dialog is displayed. See illustration below. |
| 4 | Click on OK. |
Edit Map dialog
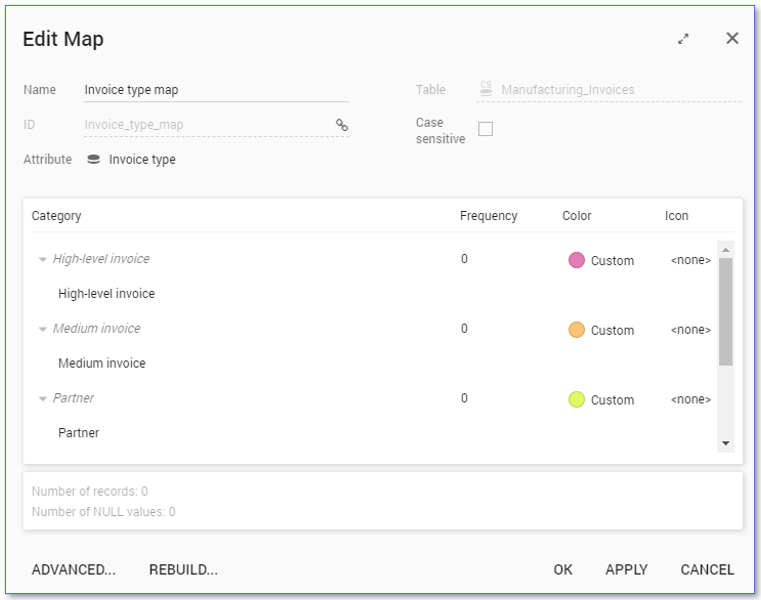
Below is a description of the elements of the Edit Map dialog.
| Element | Description |
|---|---|
| General information | Contains basic information about the expression: • Name •ID • The Table in which the new map will be placed • The Case sensitive checkbox determines whether the matching of values is case sensitive or not. |
| Attribute | The data source attribute of which the value is used as its input for the map. |
| Categories - Fields | Displays the categories within the map. The fields containing the names of the categories and the values they comprise are displayed. |
| Categories - Properties | The properties of a specific category are displayed. • Frequency indicates how many records are currently grouped within this category. (When changing the values in this map, these frequencies will automatically update.) • Color enables you to assign specific colors to categories when this map is used in a dashboard. • Icon enables you to pick an image to use as an icon for that category. |
| ADVANCED... | Displays the Advanced Settings dialog where you can define display settings or pick color palettes. |
| REBUILD... | Enables you to rebuild the map. |
You can add the map as a level in a chart. See illustration below.
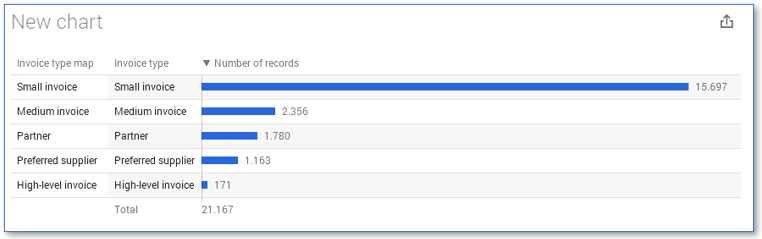
The chart has two levels. Since the map is based on the same attribute as the other level, both levels display the same result. The map can be configured.
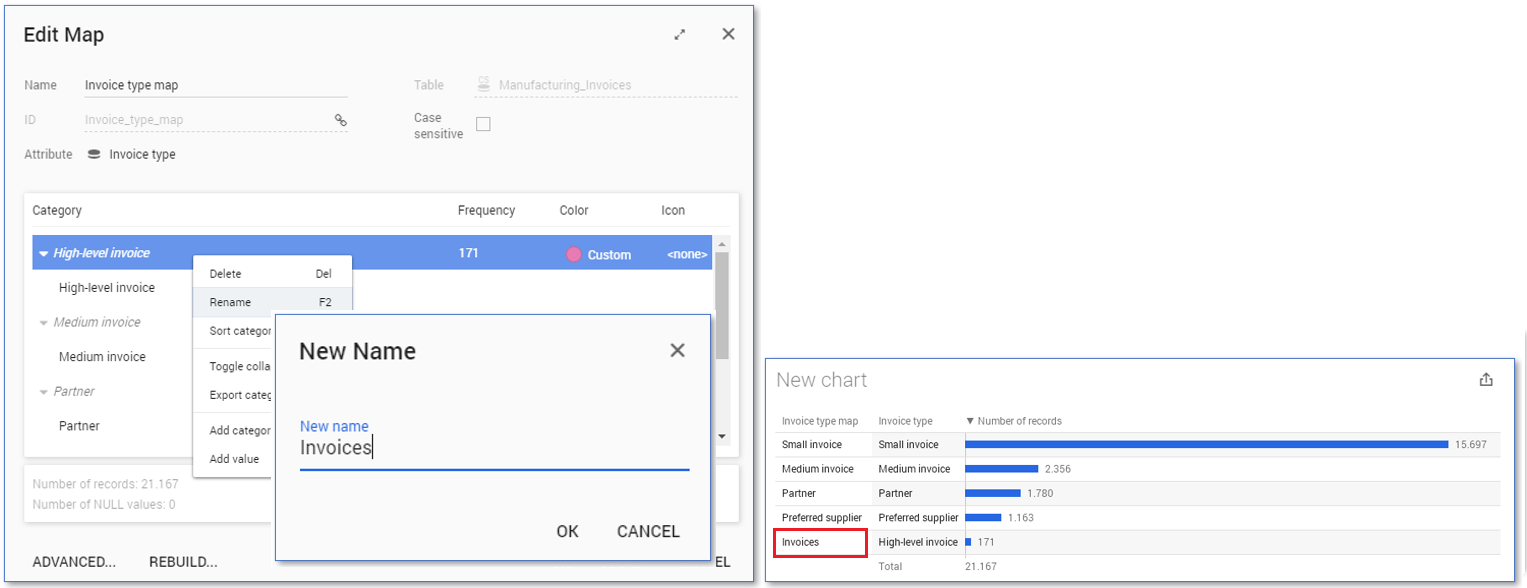
Renaming a category
Follow these steps to change the name of a category in the map.
| Step | Action |
|---|---|
| 1 | Right click on a map attribute in the table items list and select Edit.... |
| 2 | Right click on the category you want to rename and select Rename. |
| 3 | Enter a new name for the category and click on OK. |
| 4 | Click on OK to save the changes made to the map. |
See illustration below for an example.
Moving values to other categories
Follow these steps to move values to other categories.
| Step | Action |
|---|---|
| 1 | Right click on a map attribute in the table items list and select Edit.... |
| 2 | Drag and drop the value you want to move onto the new category. |
| 3 | Click on OK. |
See animation below.
Deleting a category
Follow these steps to delete a category.
| Step | Action |
|---|---|
| 1 | Right click on a the map attribute for which you want to delete a value in the table items list and select Edit.... |
| 2 | Right click on the category you want to delete and select Delete. |
| 3 | Click on OK. |
Adding values to a category
Follow these steps to add a value to a category.
| Step | Action |
|---|---|
| 1 | Right click on a the map attribute in the table items list and select Edit.... |
| 2 | Right click on the category for you want to add a value and select Add value - Text. |
| 3 | Right click on New value and select Rename. |
| 4 | Enter the name of an existing value and click on OK. |
| 5 | Click on OK to save the changes to the map. |
See animation below for an example.
Changing the color of a category
Follow these steps to change the color of a category.
| Step | Action |
|---|---|
| 1 | Right click on a the map attribute in the table items list and select Edit.... |
| 2 | Click on the Custom label in the Color column of the category for which you want to change the color and select Edit.... |
| 3 | Select the desired color and click on OK. |
| 4 | Click on OK to save the changes to the map. |
| 5 | Go to the Chart tab. |
| 6 | Drag the map attribute from the Rows level to the Stacked level. |
See animation below for an example.
