Metric selectors
Introduction
Selectors can be used to switch between metrics. In that case they are called metric selectors.
Creating a Metric selector
You must first create the metrics that you want to use in the selector.
Follow these steps to create a metric selector.
| Step | Action |
|---|---|
| 1 | In the table item list, right-click on the table for which you want to create a metric selector and select New control - Selector.... A selector New selector is added in the table item list. |
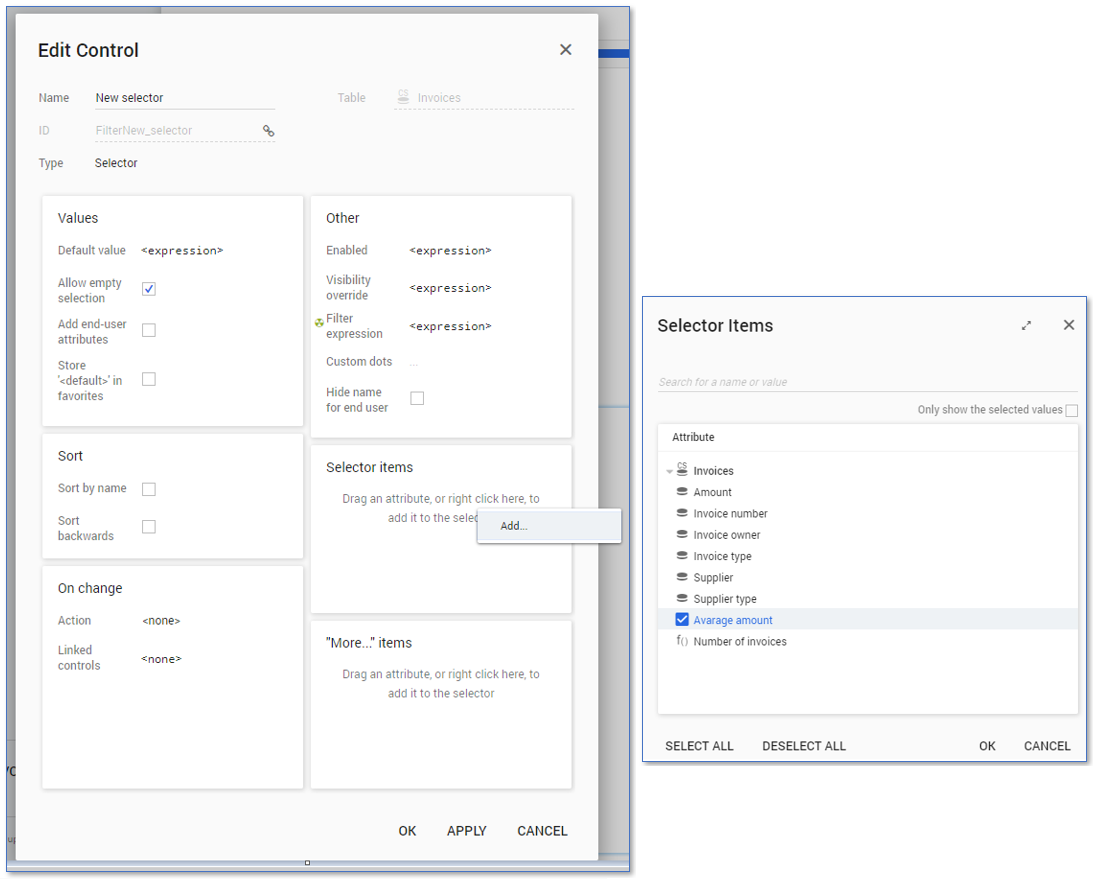
| 2 | Double click on New selector to open the Edit Control dialog. |
| 3 | Right click in the Selector items pane an click on Add.... |
| 4 | Select the metrics you want to add to the selector and click on OK. |
| 5 | If desired, you can set a Default value for the selector by adding the expression uid([default metric]). |
| 6 | Disable the checkbox Allow empty selection to enforce that either one of the available metrics from the selector is selected, and click on OK. |
Using the Metric selector on a chart
Follow these steps to add the metric selector on a chart
| Step | Action |
|---|---|
| 1 | Go to the Dashboards tab and create a new dashboard based on the table in which the metric selector control is present. |
| 2 | Go to the Chart tab. |
| 3 | Select the attribute you want to display in the chart from the Rows drop down list. |
| 4 | Select the metric selector control from the Metric drop down list. |
| 5 | Drag the metric selector control to the Header controls of the chart. |
See illustration below for an example.
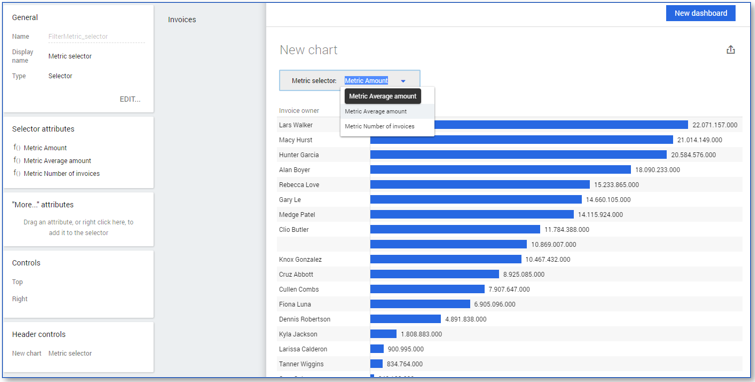
In the example the metric selector contains three metrics. By selecting a different metric in the selector, the size of the bars of the chart also change.
The default value to be displayed for a chart is the number of records. If you use a metric selector you must also create a metric for the default value if you want this as one of the available display options.
Using the Metric selector on a legacy chart
To use the metric selector on a legacy chart you must create an expression that contains the following functions.
| Function |
Description |
|---|---|
|
|
Returns the list of UIDs (unique identifiers) of the current selection of the metric selector. |
|
|
Selects one item from that list. Note: the metric selector used can only select one value at a time. |
|
|
Evaluate the selected metric. The metric function accepts either a metric or the UID of a metric. |
For example: metric(any(selecteduids(FilterMetric_selector))).
Follow these steps to add the metric selector on a legacy chart.
| Step | Action |
|---|---|
| 1 | Go to the Dashboards tab and create a new dashboard based on the table in which the metric control is present. |
| 2 | Go to the Chart tab. |
| 3 | Drag the attribute you want to display in the chart to the Rows level. |
| 4 | Drag the Metric selector control to the Header controls panel. |
| 5 | Change the Size to Expression. |
| 6 | Click on expression and enter the expression containing the elements described above. |
| 7 | Click on OK. |