Metrics
Introduction
Metrics are used to define a calculation once and reuse it in the entire app. For example, you can make a metric to calculate the number of invoices, or a metric to calculate the average amount. These metric can then be reused in different places, such as in charts, or in aggregate expressions.
Metrics vs Expressions
Expressions and metrics both have a specific purpose and work differently. Expressions create a value per record. Metrics do not have a value of their own. A metric must be used in a place where the records are accessible, e.g. aggregate expressions, charts, and HTML panels.
The same metric can be used in many places while expressions are tailored to one specific purpose.
Metrics can also be used in the calculations of other metrics.
To use a metric in an expression, it must be preceded by the function metric. The use of this function is necessary to evaluate the metric.
Creating a metric
Follow these steps to create a metric.
| Step | Action |
|---|---|
| 1 | Open the app in your development environment, and go to the Data tab. |
| 2 | In the table item list, right-click on the table for which you want to create a metric and select New metric.... |
| 3 | Enter the expression to define the metric in the Expression editor. |
| 4 | Validate the outcome in the results panel at the right. |
| 5 | Click on OK. |
The new metric is created in the table item list and identified by the ![]() icon.
icon.
Using metric in a chart
Follow these steps to use the metric in a chart.
| Step | Action |
|---|---|
| 1 | Go to the Dashboards tab and create a new dashboard based on the table in which the metric control is present. |
| 2 | Go to the Chart tab. |
| 3 | Select the attribute you want to display in the chart from the Rows drop down list. |
| 4 | Select the metric from the Metric drop down list. |
See illustration below for an example.
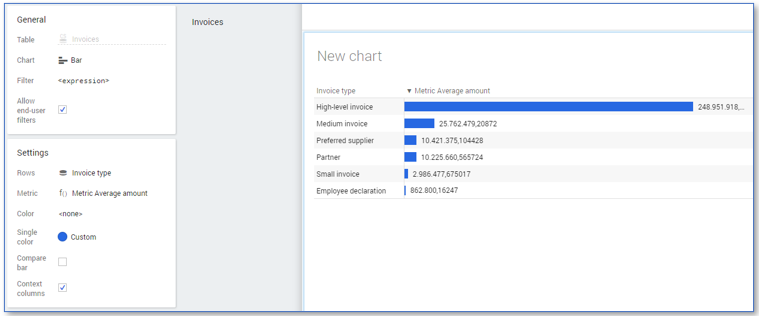
In the example the Invoice type attribute is used for the chart and the metric Metric Average amount that calculates the total income an invoice generates on average. The bar size equals the number of average amount per category.
Using a metric in a legacy chart
Follow these steps to use the metric in a legacy chart.
| Step | Action |
|---|---|
| 1 | Go to the Dashboards tab and create a new dashboard based on the table in which the metric control is present. |
| 2 | Go to the Chart tab. |
| 3 | Drag the attribute you want to display in the chart to the Rows level. |
| 4 | Change the Size to Expression. |
| 5 | Click on expression and enter an expression to use the metric you created. For example metric(Metric_Average_Amount). |
| 6 | Click on OK. |
Related information
See Metric Selectors.