Overview - Dashboard (role Analyst)
Introduction
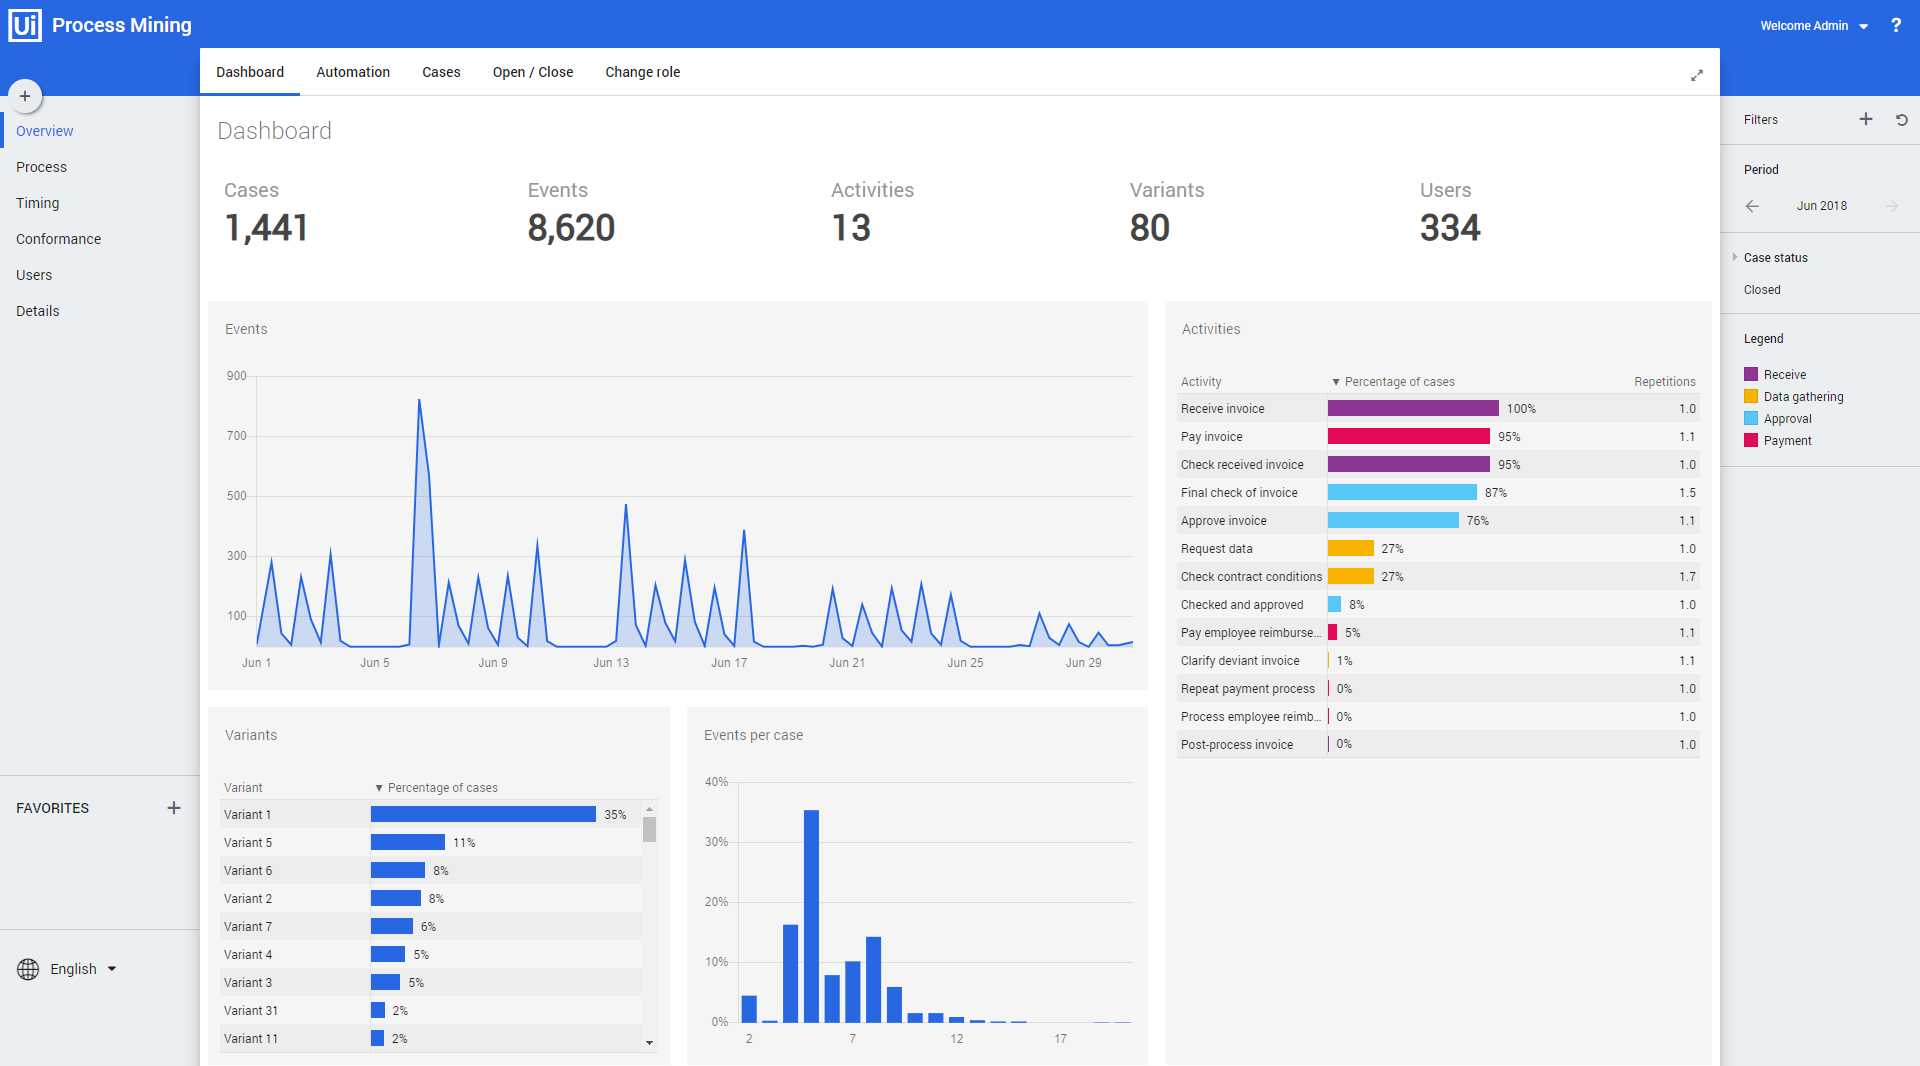
The dashboard Overview – Dashboard that is shown when selecting the Analyst role can be used to get a global overview of the data. See illustration below.
KPIs
Below is a description of the KPIs that are displayed on the top.
| KPI | Description |
|---|---|
| Cases | Total number of cases during the selected period. |
| Events | Total number of events during the selected period. |
| Activities | Total number of activities during the selected period. |
| Variants | Total number of process variants during the selected period. |
| Users | Total number of users that performed activities during the selected period. |
Dashboards charts
Below is a description of the dashboard charts of the Overview - Dashboard.
| Chart | Description |
|---|---|
| Events | A history graph that displays the number of events over the selected period of time. |
| Variants | Displays the process variants that occur most frequently. |
| Events per case | Displays the percentage of cases containing a certain number of events. |
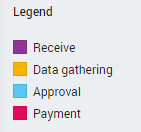
| Activities | Displays all activities and the percentage of cases in which they occur. It also shows how often the activity is repeated. The color of the bar indicates the activity type. See illustration below. |