Profiling aalysis
Introduction
This guide describes how to use the UiPath Process Mining Profiler to analyze your application and find possible bottlenecks in the performance of your application.
Preparation
To do a profiling analysis you must perform a profiling run first. You also must have a cache generated with the dataset you are profiling to have representative timings.
Analysis
In the Profiler app you can see which parts of a dashboard take the most time. You can drill down from dashboards to dashboard items, to levels, to overlays, and see all steps that are performed to load a dashboard. This information can help you optimize the performance of your dashboards.
Depending on the profiling run, the profile information can be split in the categories described in the table below.
| Category | IndiIndicates the time needed … |
|---|---|
| Dashboard | to render the dashboard(s). |
| Dashboard item | to render the dashboard item(s) of a certain dashboard. |
| Level | to render the level(s) of a certain dashboard item. |
| Overlay | by the platform to render the overlay(s) of a certain level. |
| Table initialization | to initialize the tables used. |
| Table item initialization | to initialize the table items used. |
| Task | by the platform to perform certain tasks. |
You can use the name(s) displayed in the Name column can be used to navigate to or search within the application to the issue.
The names of a Task are general names for certain actions performed by the platform and cannot be used to search or navigate. You can use the Hints within the Profiler, for more information on tasks.
The navigation through the Profiler is based on the drilldowns, by using the magnifier icons.
Context Information
The Profiler app shows context information to help you as a developer to understand the indicated timings. See illustration below.
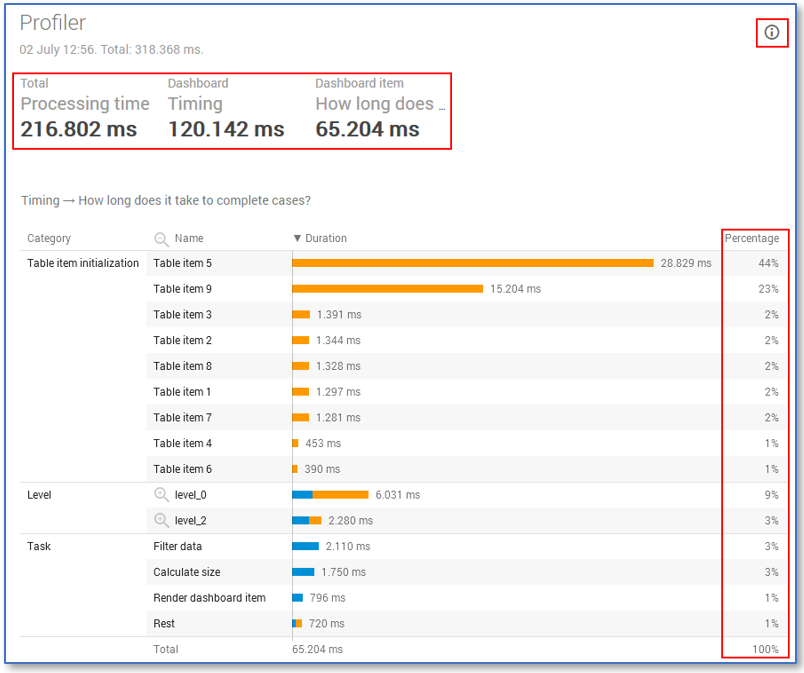
The following types of information are shown:
- At the top left, the total timing spent by the platform is displayed. If you drilldown on an item, this time is also shown on top. This gives you information of the part of timing you are analyzing as a developer compared to the entire timing.
- At the top right the Info button is displayed. If you click on this button, extra information will be shown on what the colors mean.
- The Percentage column on the right displays the percentage of time spent.
note
this percentage is always based on the last timing shown at the top of the Profiler. In this case 65.204 ms was spent to show the Dashboard item.
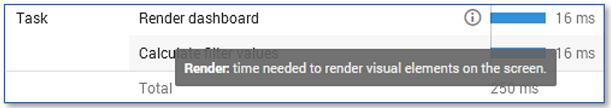
Hints for Developers
To help you to understand the tasks which are executed by the platform, the Profiler app contains hints. If you hover over a row and see the information icon popping up, a hint available with more information. In general, hints are available for all tasks which do not consider dashboard (items), levels and overlays.