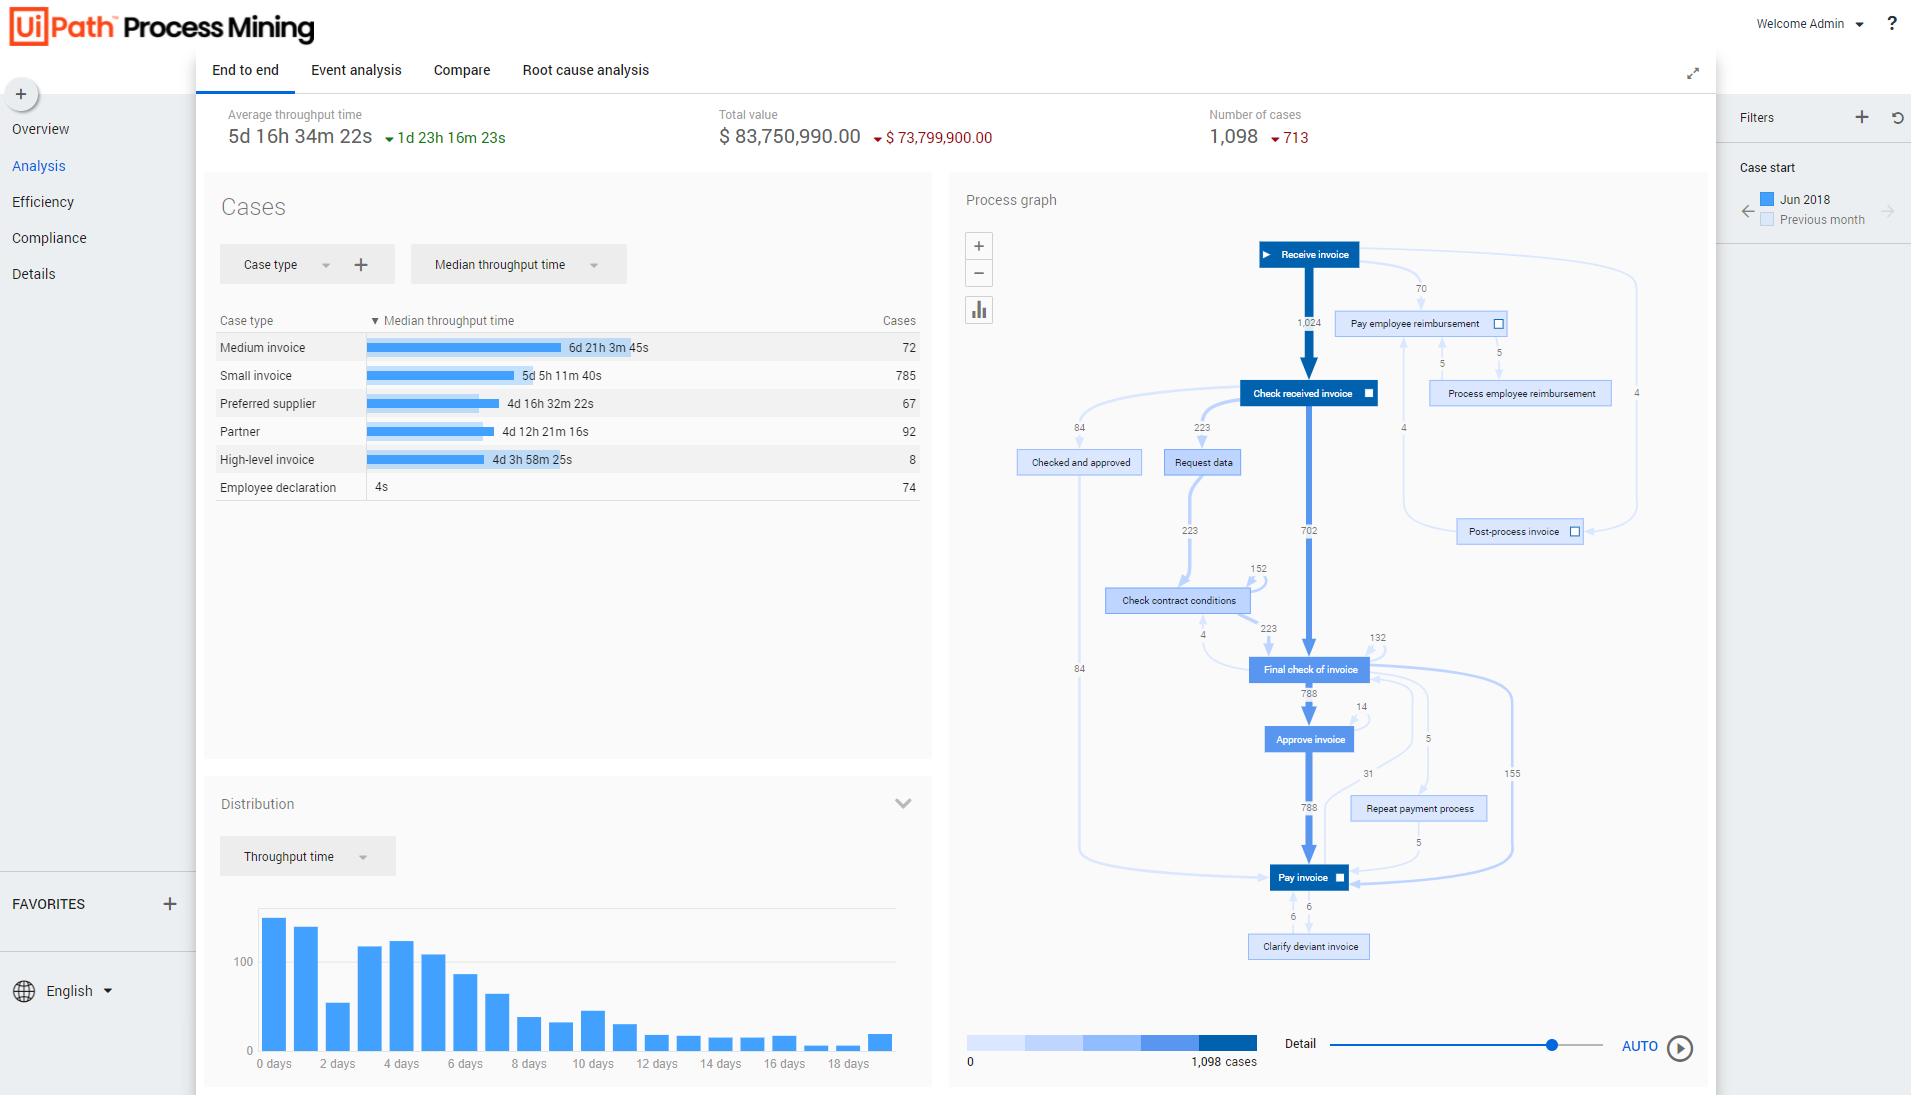
Analysis - End to End
Introduction
Analysis - End to end is the dashboard where you can analyze the complete process regarding cases.
See the illustration below.
Context information
The context bar at the top of the Analysis - End to end dashboard displays context information and KPI's.
Below is a description of the elements of the context bar.
| Element | Description |
|---|---|
| Average throughput time | The average throughput time for the end-to-end process. |
| Total value | The total value of the cases. |
| Number of cases | The total number of cases. |
Cases
The Cases dashboard item enables you to select various attributes and metrics to analyze cases.
Below is a description of the metrics that can be selected in the Cases dashboard item.
| Metric | Description |
|---|---|
| Number of cases | The number of unique cases created during the selected period. |
| Percentage of cases | The percentage of cases created during the selected period. |
| Avg. case value | The average case value of cases created during the selected period. |
| Total case value | The sum of the values of the cases created during the selected period. |
| Avg. throughput time | The average throughput time for the end-to-end process. |
| Total throughput time | The total throughput time for the end-to-end process. |
| Median throughput time | The median throughput time for the end-to-end process. |
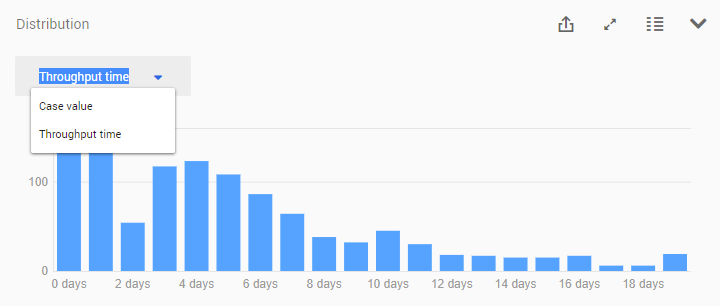
Distribution
The Distribution chart enables you to analyze the frequency of cases based on Case value or Throughput time. See the illustration below.
Process graph
The process graph displays the end-to-end process based on the number of cases. See the illustration below.
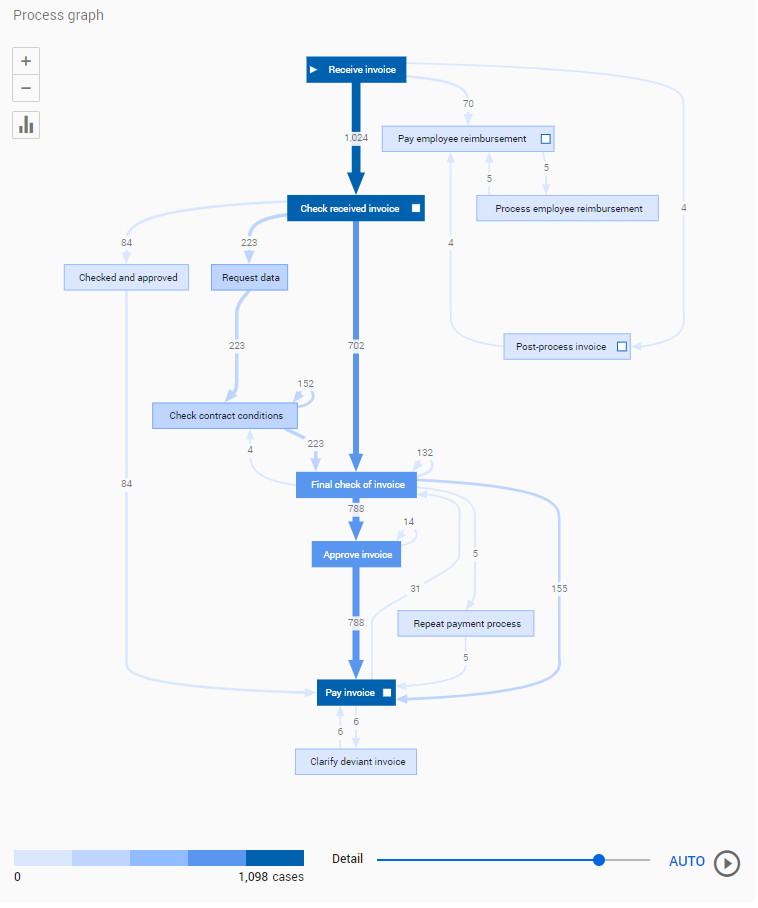
You can use the Detail slider to change the number of activities and/or edges shown.
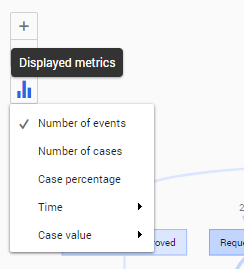
Viewing the process based on a different metric
Follow these steps to select a different metric for the process graph.
| Step | Action |
|---|---|
| 1 | Click on the Displayed metrics icon in the process graph. |
| 2 | Select a different metric from the list of available metrics. |
See the illustration below for an example.