Analysis - Event Analysis
Introduction
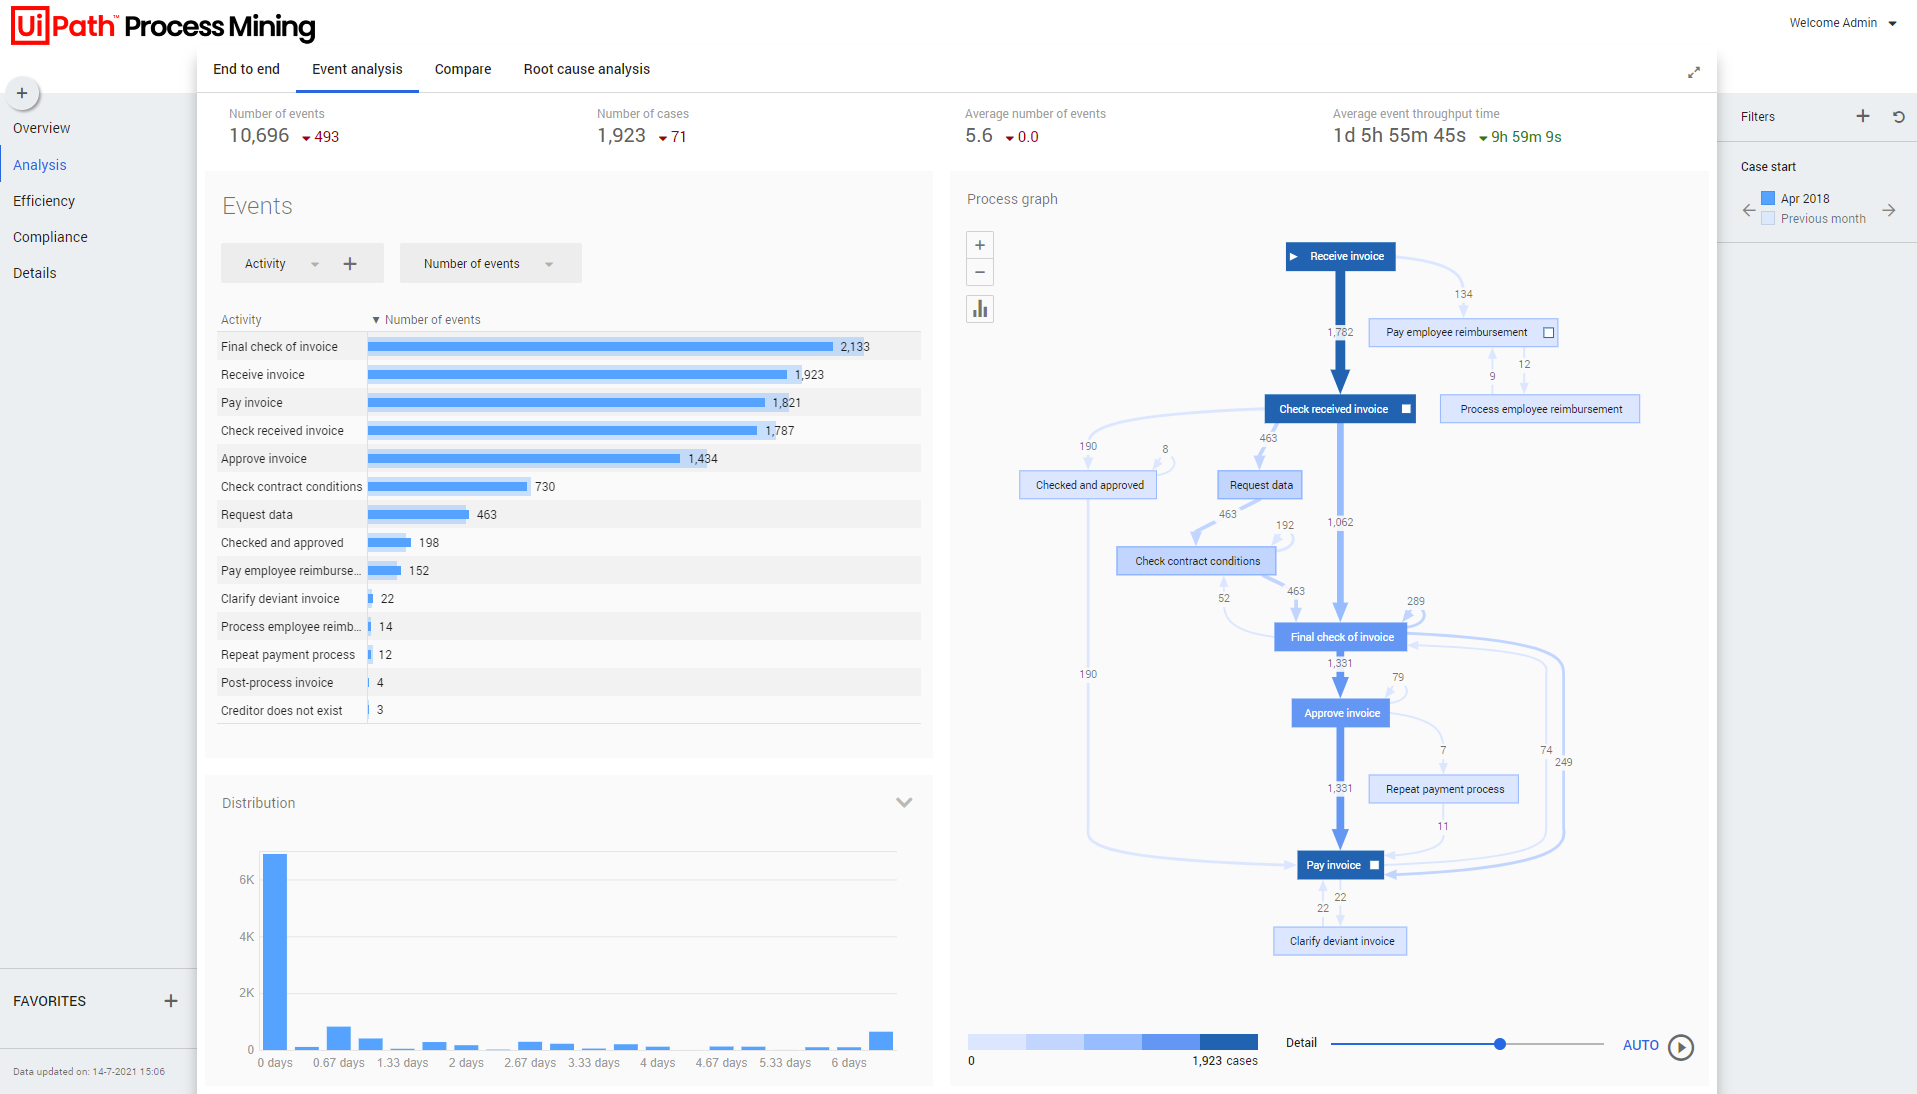
Analysis - Event analysis is the dashboard where you can analyze the complete process regarding events.
See the illustration below.
Context information
The context bar at the top of the Analysis - Event analysis dashboard displays context information and KPI's.
Below is a description of the elements of the context bar.
| Element | Description |
|---|---|
| Average number of events | The average number of events that were performed on cases. |
| Average event throughput time | The average throughput time of all events. |
| Number of events | The total number of events. |
| Number of cases | The total number of cases created. |
Events
The Events dashboard item enables you to select various attributes and metrics to analyze events.
Below is a description of the metrics that can be selected in the Events dashboard item.
| Metric | Description |
|---|---|
| Number of events | The number of unique events for cases that were created within the selected period. |
| Percentage of events | The percentage of events for cases that were created within the selected period, related to the total number of events. |
| Percentage of cases | The percentage of cases that were created within the selected period, related to the total number of cases. |
| Avg. number of events | The average number of events that were performed on cases that were created within the selected period. |
| Avg. event throughput time | The average throughput time of all events,for cases that were created within the selected period. |
| Median event throughput time | The median throughput time of all events, for cases that were created within the selected period. |
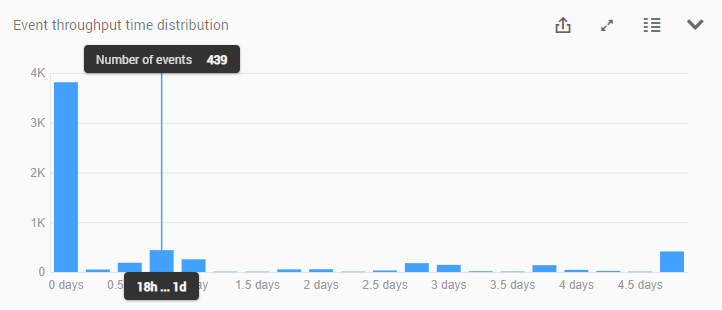
Distribution
The Distribution chart enables you to analyze the frequency of events based on the Throughput time. See the illustration below.
Process graph
The process graph displays the end-to-end process based on the number of cases. See the illustration below.
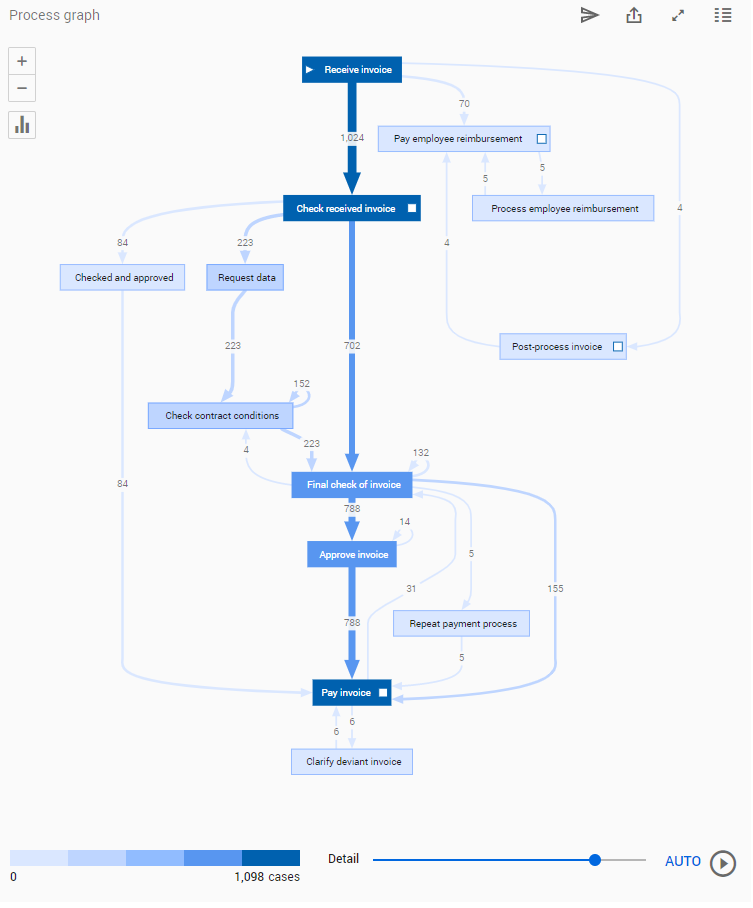
You can use the Detail slider to change the number of activities and/or edges shown.
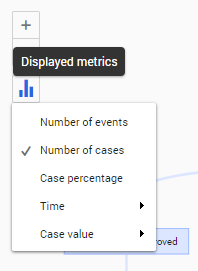
Viewing the process based on a different metric
Follow these steps to select a different metric for the process graph.
| Step | Action |
|---|---|
| 1 | Click on the Displayed metrics icon in the process graph. |
| 2 | Select a different metric from the list of available metrics. |
See the illustration below for an example.
See also Working with Process Graphs.