Details - Case Overview
Introduction
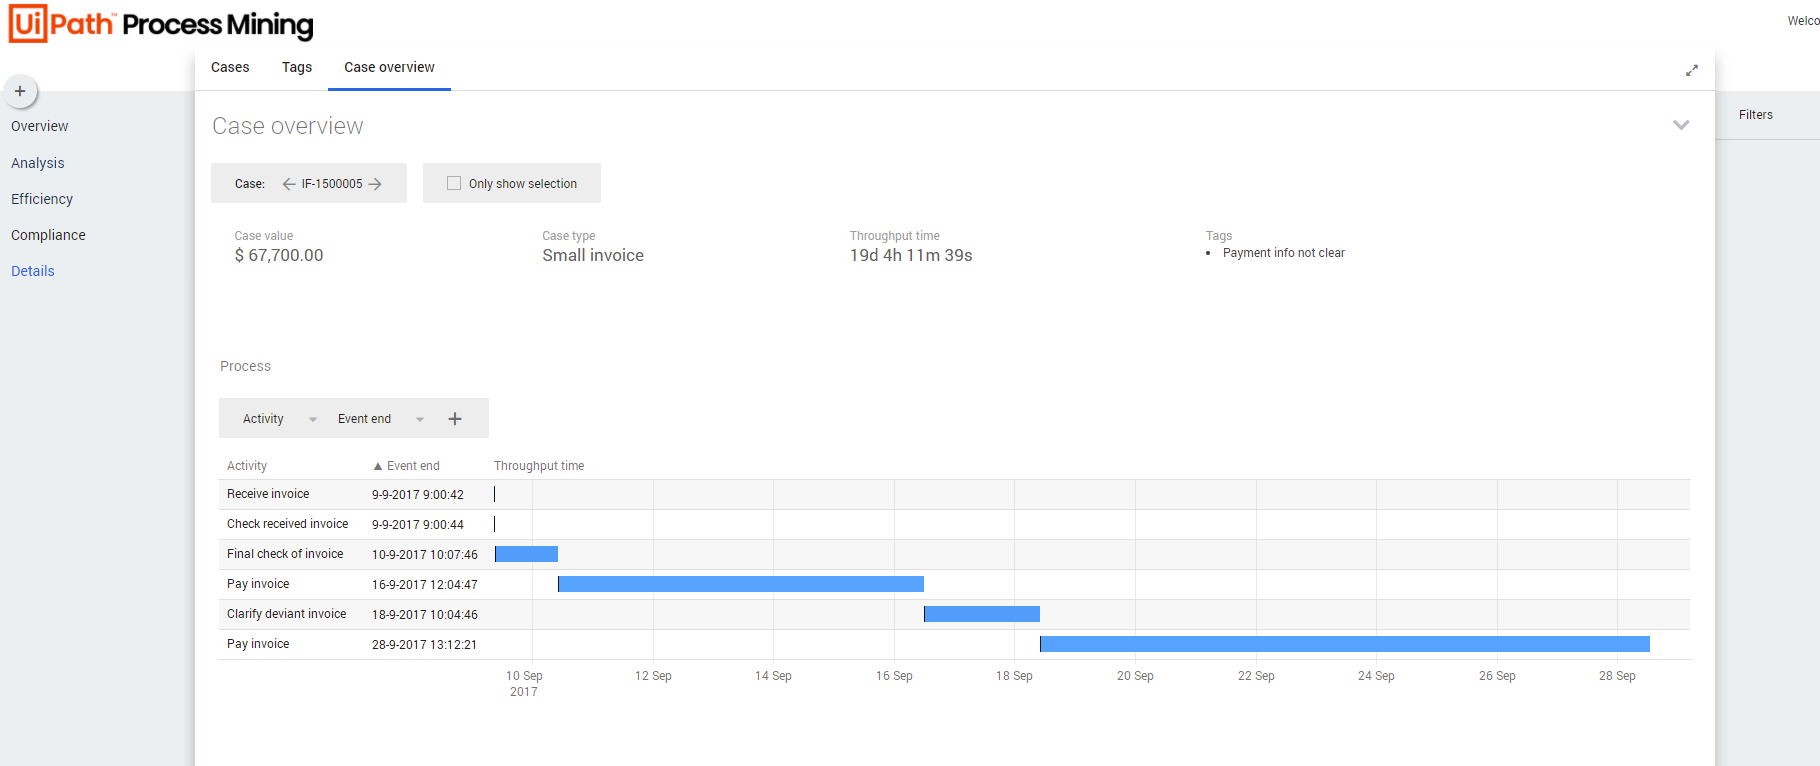
Details – Case overview displays the details of one selected case. It provides an overview of all information related to that case. See the illustration below.
Context information
The context bar at the top of the Details - Case overview dashboard displays context information and KPI's.
Below is a description of the elements of the context bar.
| Element | Description |
|---|---|
| Case value | The total value of the case. |
| Case type | The type of the case. |
| Throughput time | The throughput time for the case. |
| Tags | Any tags that are assigned to the case. |
Building the chart
By default, the chart displays the throughput time for activities, based on the event end. You can select different attributes from the selector to analyze the throughput time for the case from a different perspective. You can also extend the chart by adding additional attributes to the chart. See the animation below.