Efficiency - Automation
Introduction
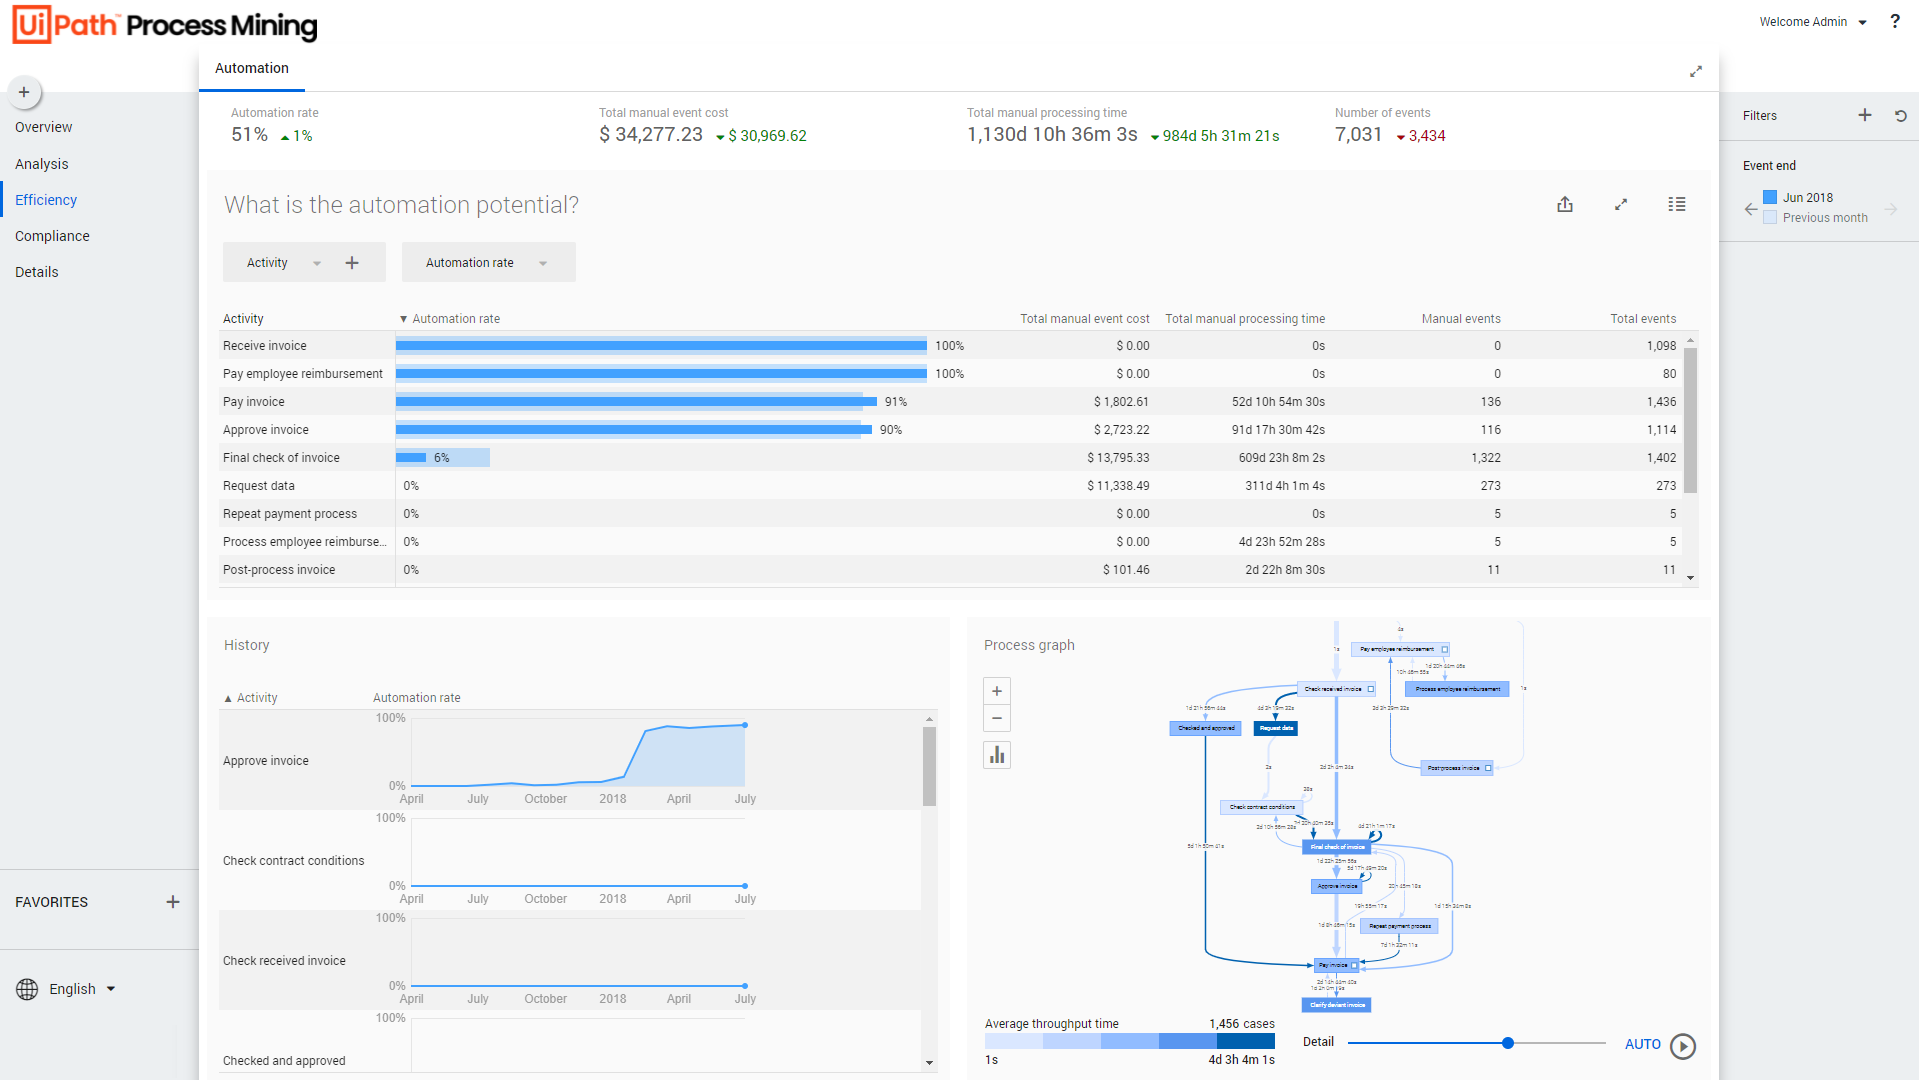
The Efficiency – Automation dashboard can be used to find automation opportunities in the process. It provides information on how much each activity has been automated, the cost of manual processing, monitoring automation rates, etc. See the illustration below.
If you want to use the Efficiency - Automation dashboard, the attributes Event cost and Event processing time must be loaded in the Events table. See Input tables of TemplateOne - Events.
Context information
The context bar at the top of the Efficiency – Automation dashboard displays context information and KPI's.
Below is a description of the elements of the context bar.
| Element | Description |
|---|---|
| Automation rate | The percentage of events that are automated. |
| Total manual event cost | The total costs of executing an event. |
| Total manual processing time | The total amount of time that is actually spent working for the event. |
| Number of events | The total number of events. |
What is the Automation Potential?
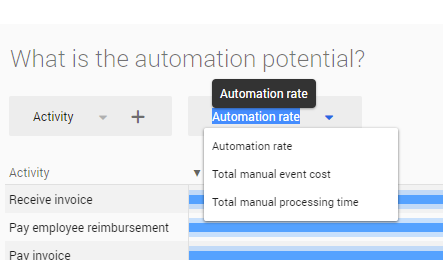
For the selected attribute the Automation rate is displayed for the current and the previous period. The dashboard also displays information about the costs involved in the execution of an event which indicates the benefit of automating the event. Instead of the Automation rate, you can select the Total manual event cost, or the Total manual processing time as the main metric to be displayed on the dashboard. See illustration below.
History graph
The History graph displays the metric values for the selected attribute over time. See illustration below.
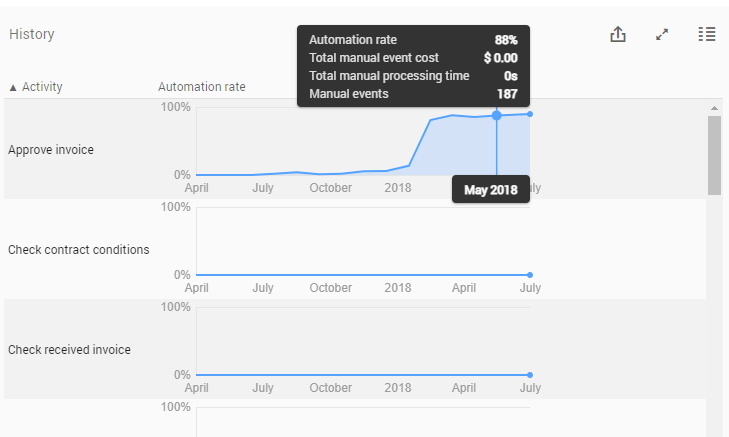
Below is a description of the different metrics.
| Metric | Description |
|---|---|
| Automation rate | Percentage of events that is automated. |
| Total manual event cost | Represents the total costs of executing an event. |
| Total manual processing time | The amount of time a person is actually working for the event. |
| Manual events | The number of events that are not automated. |
Process graph
The process graph provides a visual representation of event processing times related to the number of cases in the process. When hovering over an activity, Automation rate, the Total manual event cost, the Total manual processing time and the number of events for the activity are displayed in the hint. See illustration below.
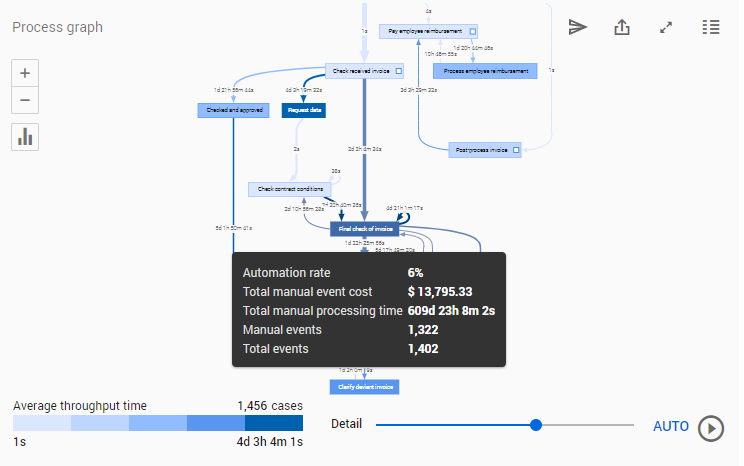
You can use the Detail slider to change the number of activities and/or edges shown.
When hovering over an edge, the average throughput time and the number of events for the edge are displayed in the hint. See illustration below.
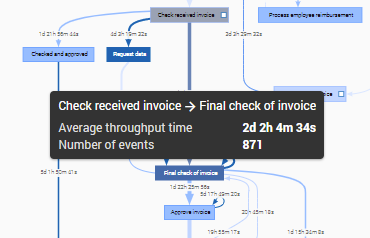
Below is a description of the metrics.
| Metric | Description |
|---|---|
| Average throughput time | The average duration of the events, which is defined by the average amount of time between two event end timestamps. |
| Number of events | The total number of events for the activity/edge. |
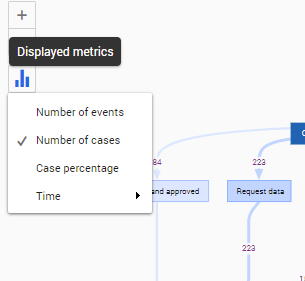
Viewing the process based on a different metric
Follow these steps to select a different metric for the process graph.
| Step | Action |
|---|---|
| 1 | Click on the Displayed metrics icon in the process graph. |
| 2 | Select a different metric from the list of available metrics. |
See the illustration below for an example.
See also Working with Process Graphs.