The Status tab
Introduction
The Status tab displays Server Status information. Moreover, it enables you to scan your server using Server diagnostics. See the illustration below.
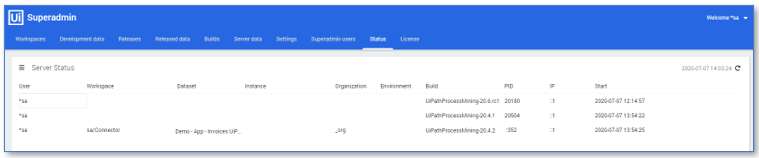
Below is a description of the elements of the Status tab.
| Element | Description |
|---|---|
| Server Status menu | Enables you to select the fields visible in the Server Status pane and to start a Server diagnostic run. |
| Refresh | The date and time at which the Server Status pane was last refreshed. You can refresh the Server Status pane by clicking on the Refresh icon. |
| User | The user who performed the action. |
| Workspace | The workspace from which the action was done. |
| Dataset | The dataset used to perform the action. |
| Instance | A reference to the instance that was opened. |
| Organization | The organization code. |
| Environment | The environment on which the instance was opened. |
| Build | The build that was used with the performed action. |
| PID | The Process ID. |
| IP | The IP address of the user who performed the action. |
| Start | The start date and time of the performed action. |
Server Status menu
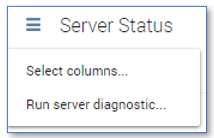
You can display the Server Status menu by clicking on the menu icon.
Below is an illustration of the Server Status menu.
The table below describes the items of the Server Status menu.
| Menu item | Desciption |
|---|---|
| Select columns... | Enables you to select the columns visible in the Server Status pane. |
| Run server diagnostic... | Enables you to start a scan to check the server status. |
The results of the scan are displayed in the Server Diagnostic dialog. See illustration below.
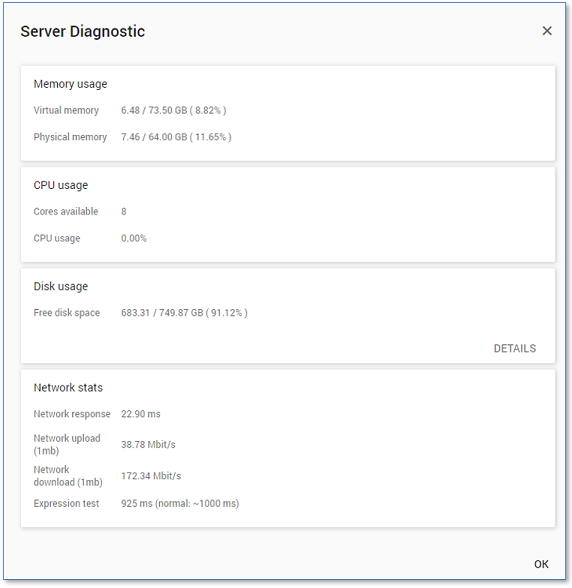
By clicking on DETAILS, the disk usage is broken down into several
categories and displayed in the Disk Usage dialog. See the illustration below.
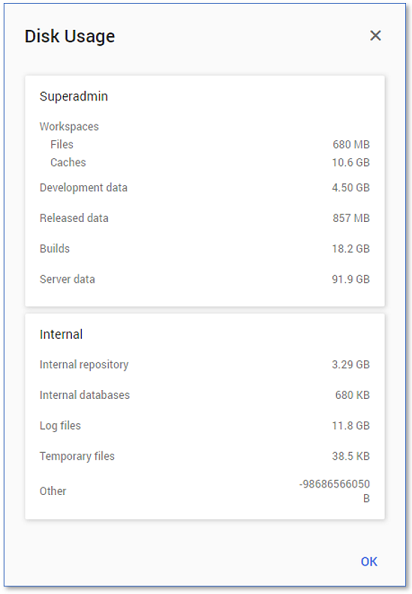
Consult your UiPath Process Mining contact if you need assistance on resolving issues from the Server diagnostics.
See also Performance.