Timing - Timing
Introduction
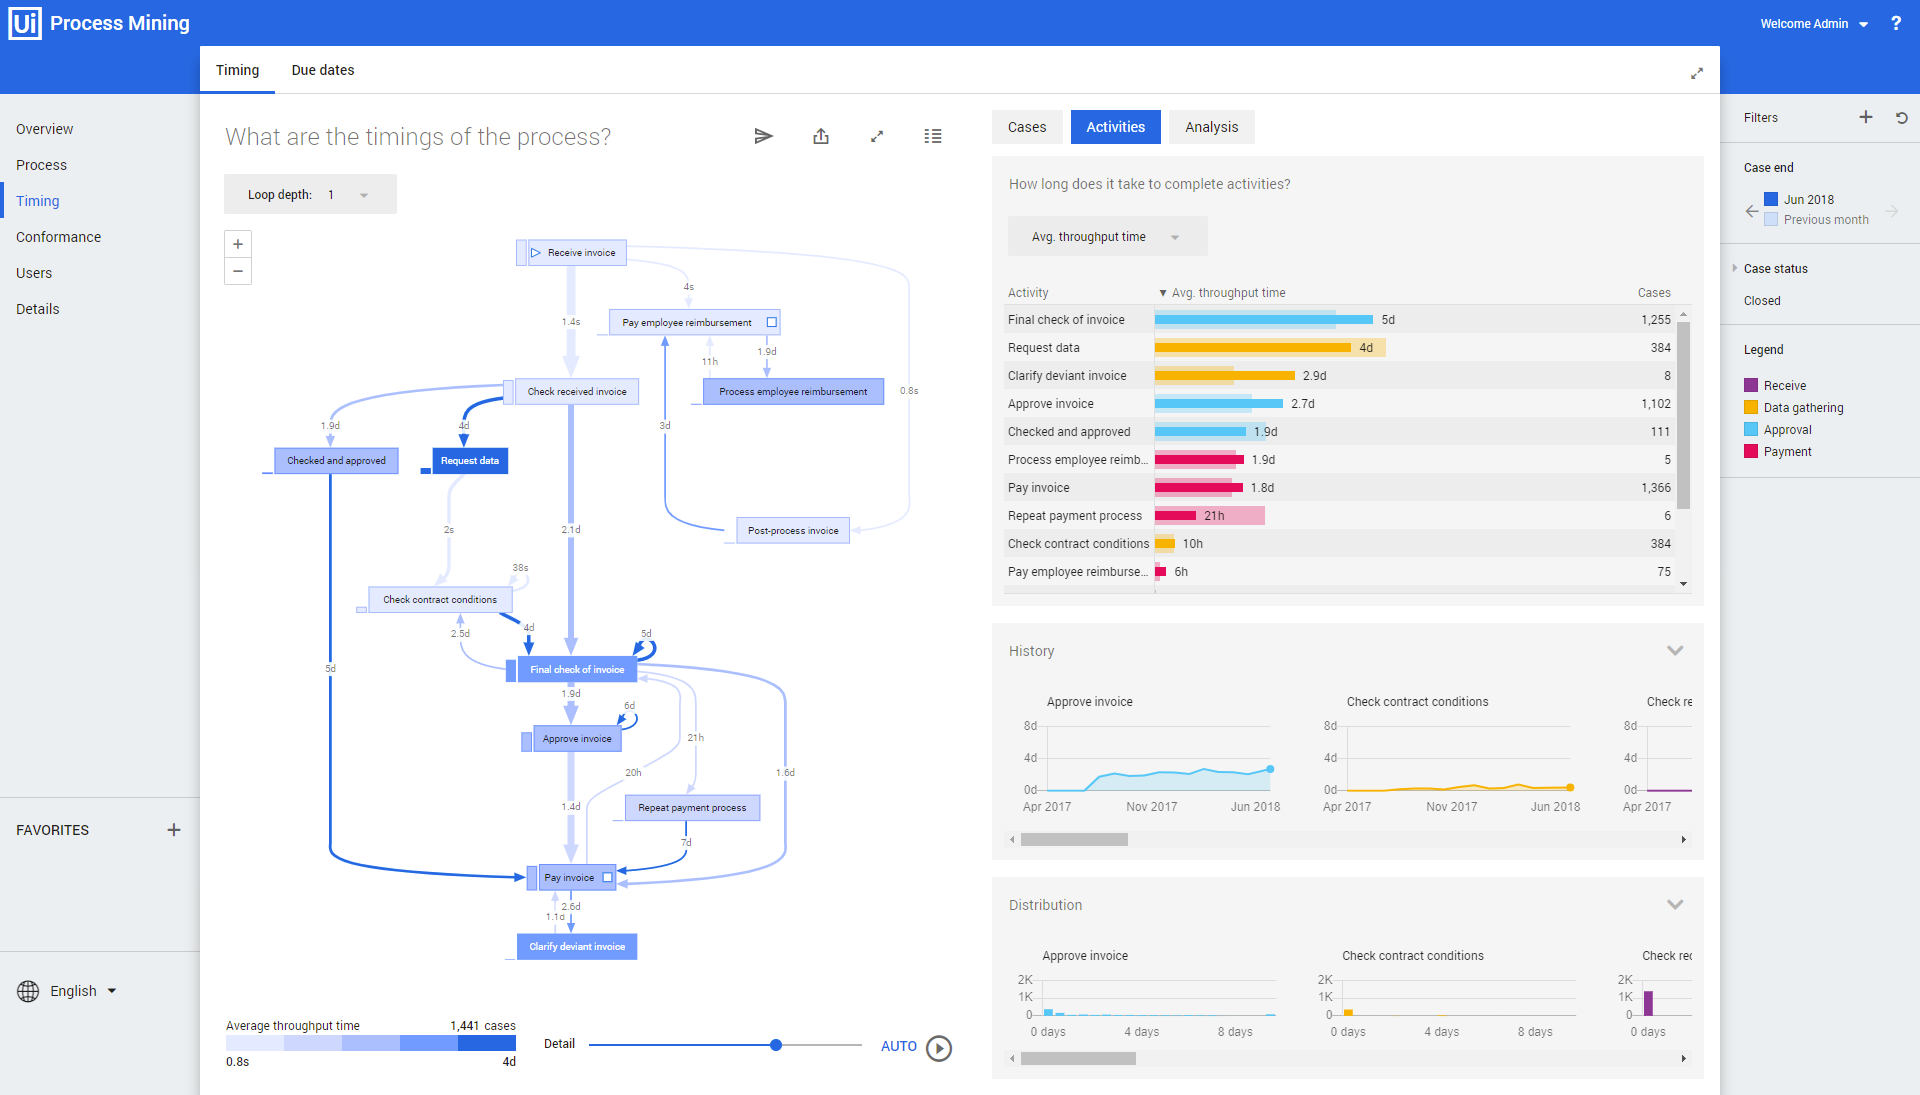
Timing - Timing is the dashboard that can be used to analyze the timings and costs to find bottlenecks in the process. The bottlenecks might have an explanation but may also be improvable steps in the process.
The Timing-Timing dashboard shows information on how long the process takes, the average throughput and cycle times. Besides it shows the activities that take the most time and the users that take the most time to execute activities.
Depending on the level of the analysis, the following three tabs can be used:
-
Cases
-
Activities
-
Analysis (cross analysis of cases and activities)
Dashboard items
Below is a description of the dashboard item of the Timing - Timing dashboard.
| Dashboard item | Description |
|---|---|
| What are the timings of the process? | Displays a process graph including the throughput times of the activities and the transitions between the activities. |
| Cases | Displays: • the total or average timings it takes to complete cases. • the related history of the case timing. • the throughput/cycle times in days per case. |
| Activities | Displays: • the total or average timings it takes to complete activities. • the related history of the activity timing. • the throughput/cycle times in days per activity. |
| Analysis | Displays: • a cross table which contains information of how long it takes to complete activities. • the related history of the cross table information. |
Cycle time represents the time between the start and the end of the event execution and is only available if the start time of events defined in the data.